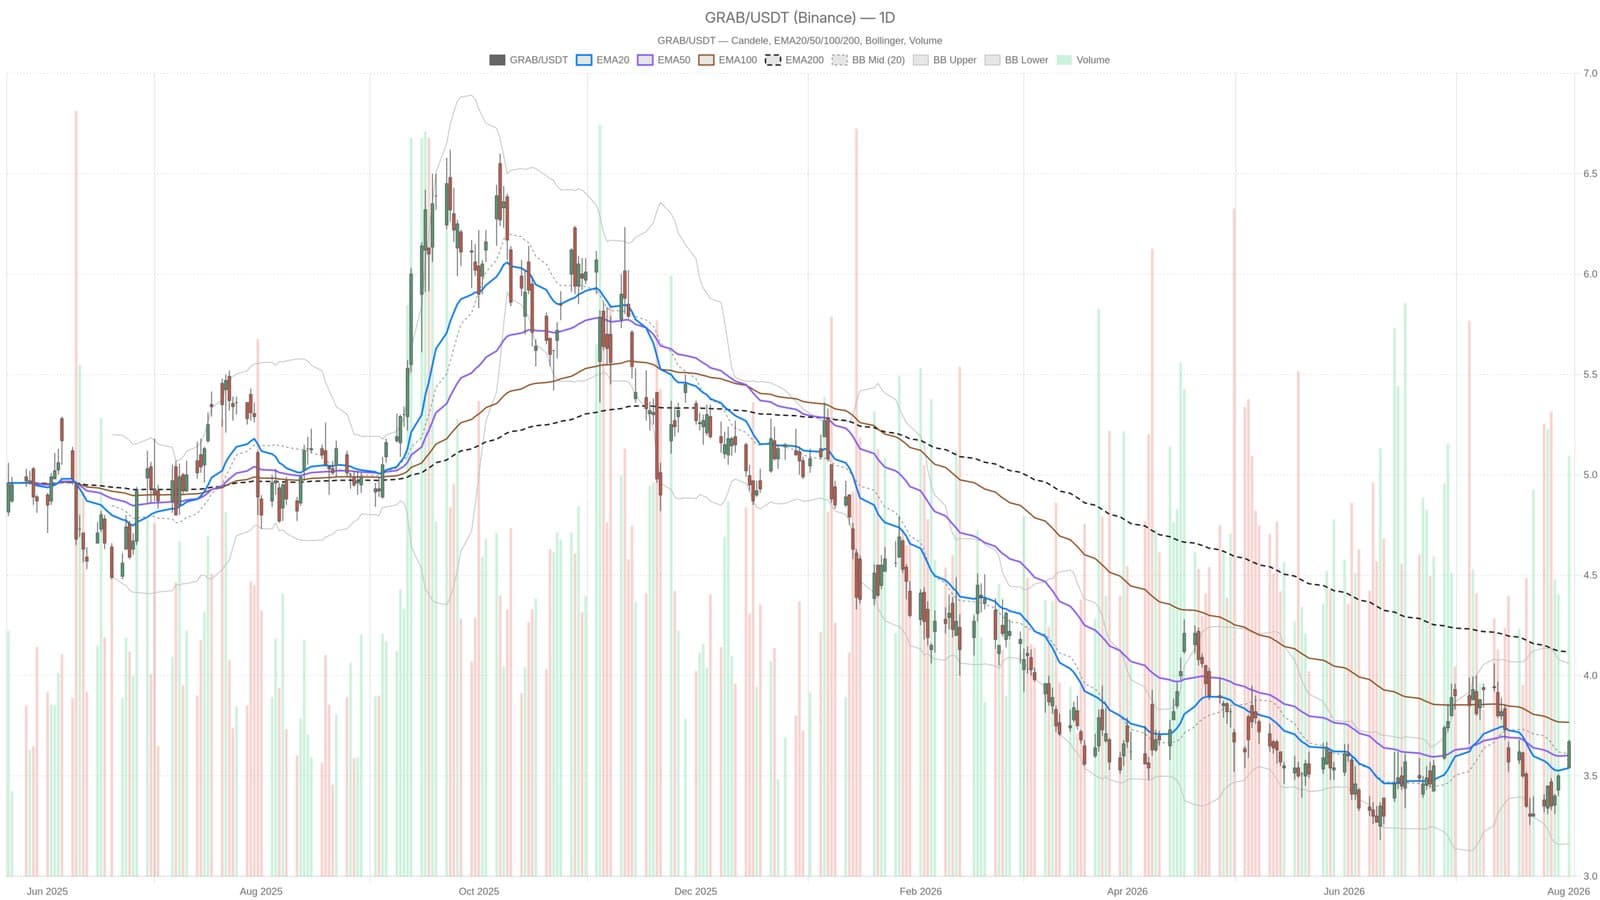
Grab Holdings jumped to $3.67 on August 3 after crushing second-quarter expectations and lifting full-year guidance. The stock opened at $3.54 and closed near session highs, a clean win for bulls hunting proof that the fintech giant's turnaround is real.
The fundamentals look solid. Record Q2 profit growth and a raised outlook give the rally genuine legs, not just a one-day flush. Price now sits comfortably above the 20-day moving average at $3.54 and the 50-day at $3.60, meaning short-term momentum has flipped bullish. That part matters for traders.
But the longer picture stays murky. The 200-day average sits at $4.12, nearly 50 cents above where Grab trades now. The stock hasn't closed that gap. Yes, the rally is real. No, it hasn't repaired the bigger technical damage yet.
Momentum meter shows strain
Daily RSI14 came in at 55.22, neutral and healthy. Plenty of room left before mean-reversion kicks in. The daily MACD, though, is balanced on a knife's edge. Both the line and signal sit at minus 0.05, histogram flat at zero. A bullish crossover here would confirm the move. Failure to cross leaves everything still unconfirmed.
The real problem lives on the hourly chart. RSI14 there hit 82.57, deep into overbought territory. That's the kind of reading that precedes a sharp pullback, not continuation. Traders expecting a smooth ride higher should brace for near-term chop.
The pivot zone between $3.58 and $3.72 is where the next battle happens. That's tight, volatile ground. Grab closed near the top of that range, which means there's real resistance just overhead and real support just below.
Earnings beat the Street. Guidance went up. But on a one-hour timeframe, the overbought meter is flashing yellow and the daily MACD can't confirm whether this breaks the longer downtrend or just bounces inside it. Traders are split on what comes next.
This material is informational only and not financial advice. Consult a professional before making investment decisions.