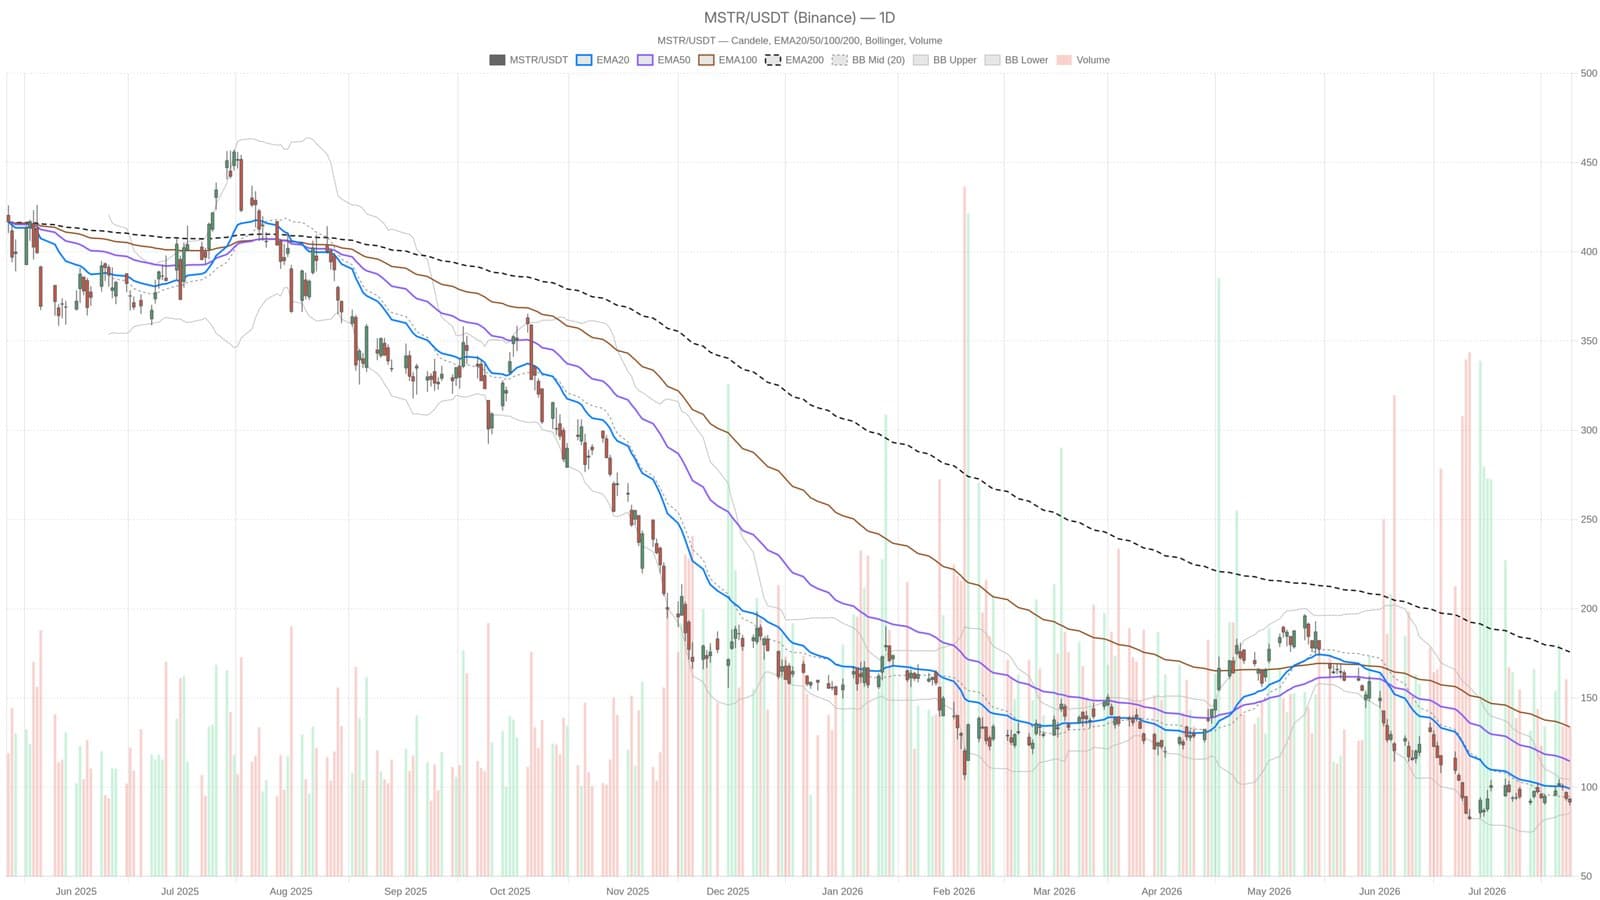
On July 24, Strategy stock closed at $91.67, stuck beneath every major moving average, signaling a persistent bearish trend across all timeframes.
The daily chart shows a clear downtrend with the price sitting below the EMA20 at $99.09, EMA50 at $114.51, and EMA200 at $175.71. This alignment of moving averages forms a solid bearish stack, with each acting as resistance.
The stock's distance from its previous highs is striking, especially when considering the EMA200 level. The daily RSI at 39.14 edges toward oversold but hasn’t hit a bottom, implying that the selling pressure might still intensify before any technical support forms.
However, the MACD histogram recently turned positive at +1.8, offering a rare sign of slowing bearish momentum. Despite this, the MACD line and signal remain well below zero, so no clear reversal is confirmed yet.
Volatility is notable, with the average true range at 5.52 suggesting daily price swings can be significant. Bollinger Bands place the midline at $94.89 and the lower band at $85.67. Current prices pressing below the midline hint that the stock is navigating the lower half of recent ranges.
The daily pivot point lies almost exactly at the closing price of $91.67, with immediate support at $89.73 and resistance at $93.65. Falling below the pivot could quickly bring the $89.73 support into focus.
Shorter timeframes confirm the bearish outlook. The hourly chart shows all moving averages aligned downward, with no signs of recovery momentum. Sellers maintain control, and any bounce attempts have yet to gain traction.
The company’s financial position includes a $3.225 billion reserve, but its performance remains highly sensitive to Bitcoin price fluctuations.