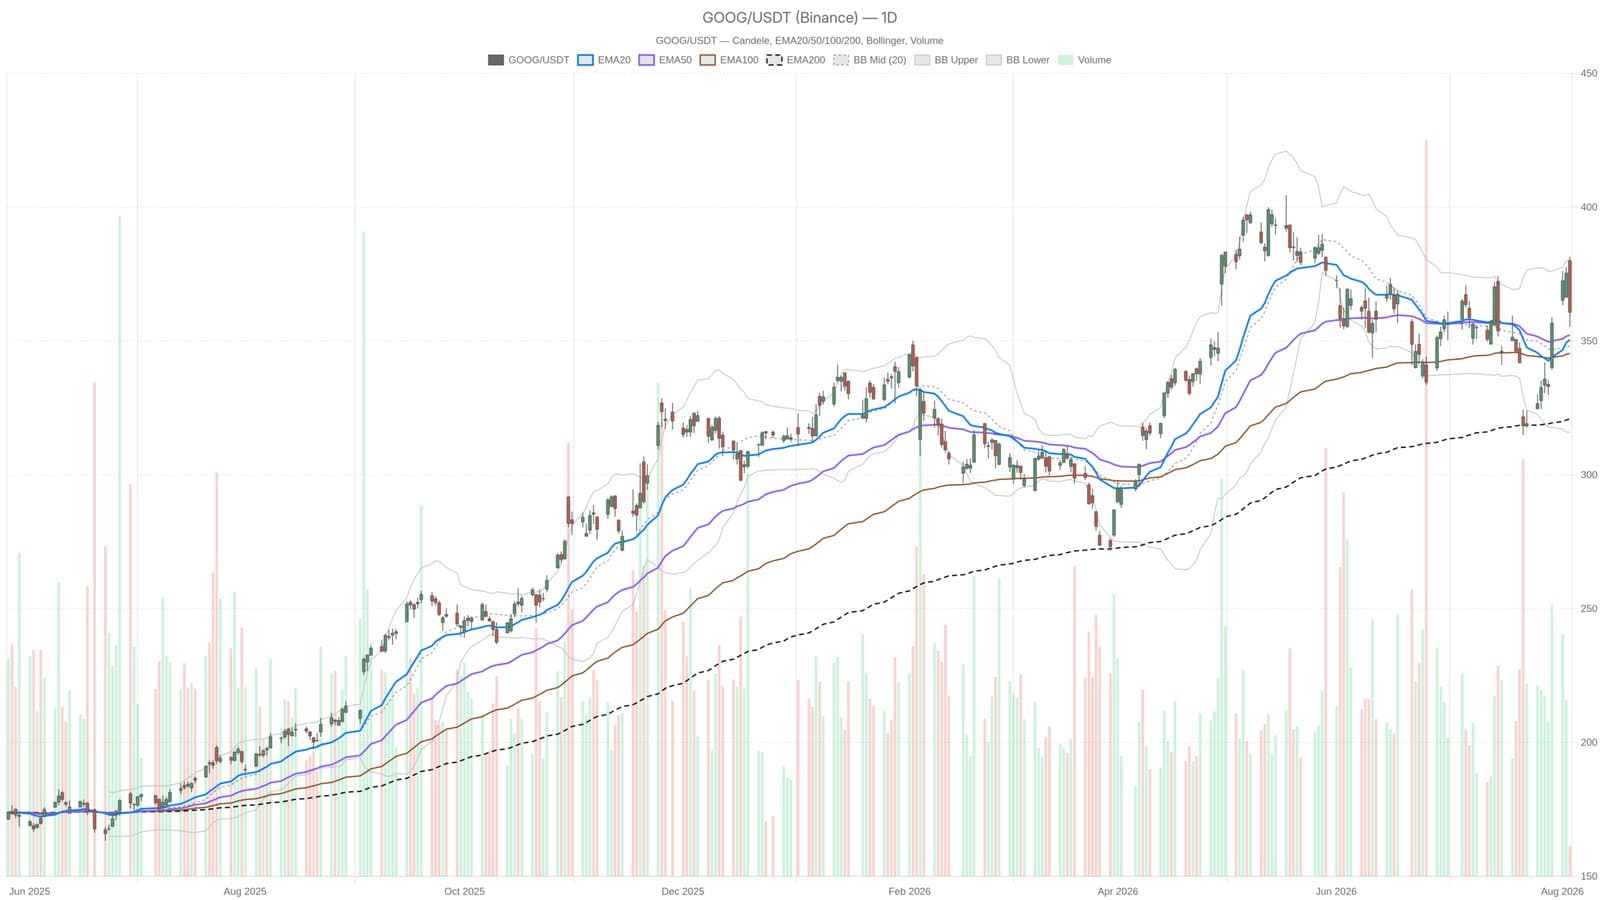
Alphabet stock dropped from an intraday peak of 381.49 to 360.77 in a single brutal session, shedding roughly $20 per share on heavy volume of 3.3 million shares. The selloff followed Q2 earnings that revealed negative free cash flow, catching the market off guard and erasing the gains that had built up over prior weeks.
What makes this move interesting is the disconnect between what the daily chart says and what traders actually did. Price still sits comfortably above all three major moving averages, the 20-day at 350.47, the 50-day at 352.15, and the 200-day at 320.89. That's textbook bullish alignment. Yet the close landed dead center of the day's range, nowhere near the highs. That's distribution, not buyers stepping in to defend the level.
The hourly MACD has flipped bearish, directly contradicting the daily momentum indicators which still show positive readings. RSI14 on the daily sits at 54.56, neutral territory with room to fall before hitting oversold. The MACD line itself sits at 0.83 against a signal of negative 3.31, producing a positive histogram of 4.13, but that reading likely reflects yesterday's strength rather than today's reversal.
Volatility has spiked noticeably. ATR14 expanded to 13.87, signaling wider daily swings are coming. The real danger zone sits just below, near the 350.16 support confluence. If that breaks, the next meaningful floor drops all the way down to 315.93, a level that would represent a genuine invalidation of the bullish structure that's held since the summer lows.
For now, Alphabet remains technically above water. But the Q2 cash flow miss has cracked the narrative, and traders are watching to see if this dip finds buyers or rolls over into something worse.
This article is for informational purposes only and should not be considered financial advice or a recommendation to buy or sell any security.