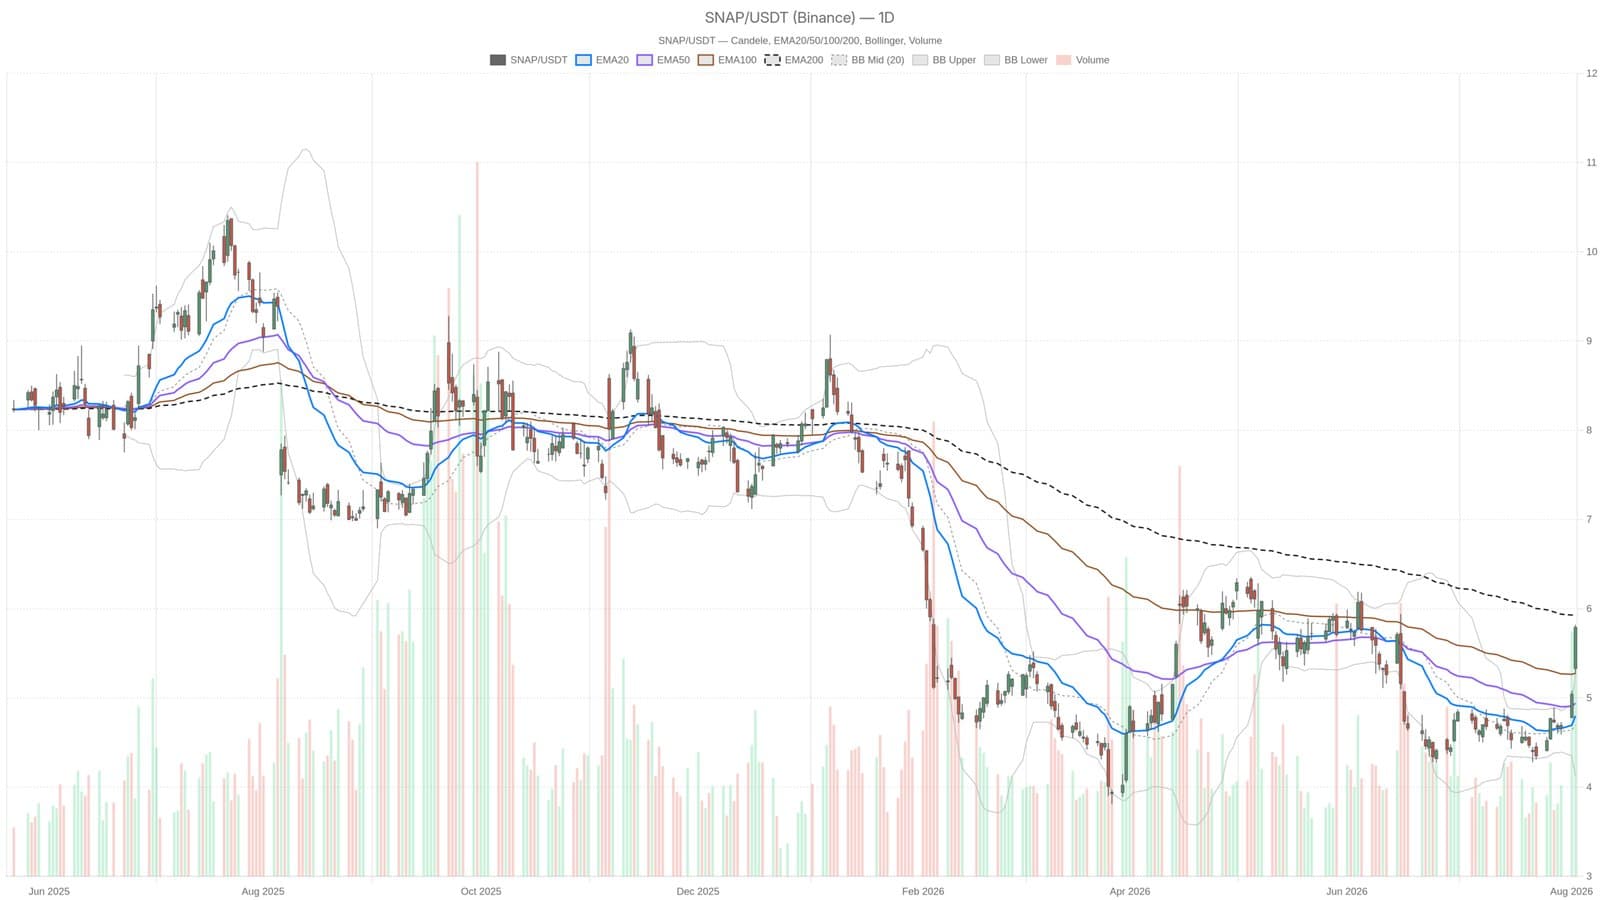
Snap Inc. shares rocketed 6% higher on August 4 following a solid Q2 earnings report, settling at $5.79. Revenue climbed to $1.6 billion, a 19% year-over-year gain, while daily active users reached 493 million. The move looked bullish on the surface. The technical setup, however, tells a different story underneath.
Short-Term Strength Meets Long-Term Ceiling
Price cleared both the 20-day EMA at $4.80 and the 50-day EMA at $4.94 with conviction. That confirms momentum has shifted decisively upward in the near term. But here is the catch: the stock remains pinned below the 200-day EMA at $5.93. This longer-term moving average acts as a hard ceiling. The divergence between what short-term charts show and what the broader trend line says creates a neutral regime, despite all the optimism around earnings.
The gap matters because it explains why a 6% rally does not automatically translate into a new uptrend. Snap broke above intermediate resistance but has not yet convinced the longer-term players that the coast is clear. The $5.93 level is the real test. Break above it and the broader trend flips bullish. Stay below and the rally risks rolling over into consolidation or pullback.
Momentum Already Running Hot
The daily RSI sits at 74.33, deep in overbought territory. That is the kind of reading that typically precedes at least a pause, if not a reversal. The MACD line crossed above its signal line, which does signal bullish momentum building, but the RSI warning suggests the move has already run hard and fast. Tuesday's close pushed above the upper Bollinger Band at $5.28, a sign of aggressive, volatility-driven expansion that often comes just before consolidation sets in.
Traders watching the pivot point at $5.63 will see the stock currently trading above it, but the real action happens at the resistance zone between $5.93 and $5.98. Support sits at $5.43. The next few trading sessions will determine whether this earnings bounce has legs or whether it fizzles out before reaching that critical 200-day level.
This material is for informational purposes only and should not be construed as financial advice or a recommendation to buy or sell any security.