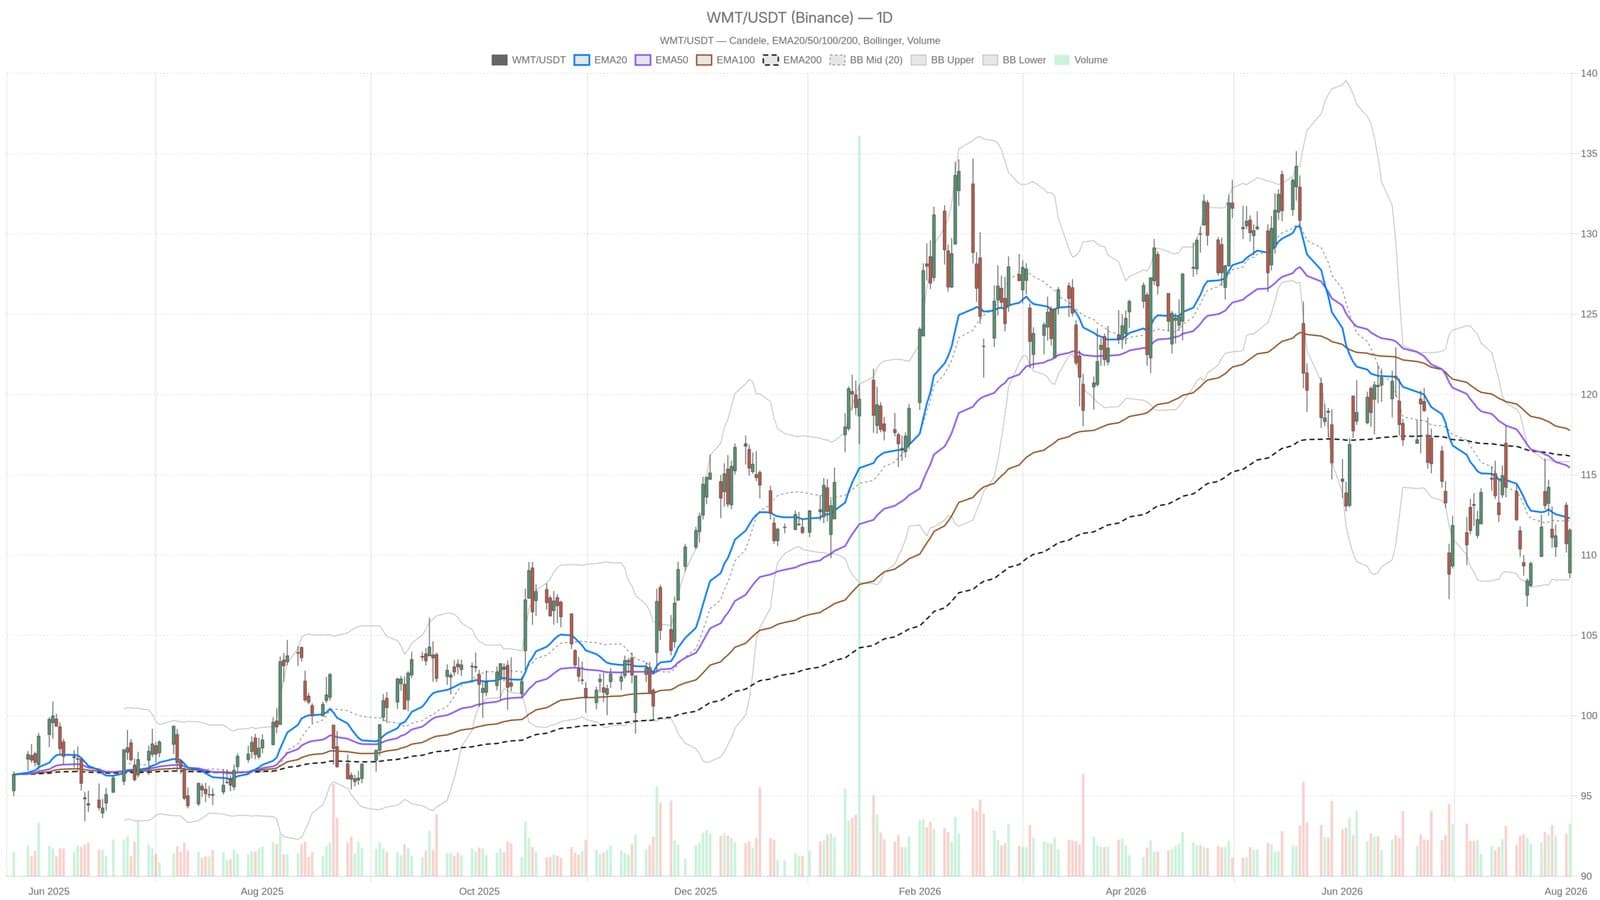
Walmart shares dropped below $112 on August 4, caught in a persistent downtrend that just got worse. Oppenheimer pulled its $140 price target and downgraded the stock to Perform from Outperform, a move that signals fading conviction ahead of earnings on August 20. Year to date the stock is down 17 percent.
The technical picture looks grim. Price closed at $111.55, sitting comfortably below all three major moving averages, the 20-day at $112.29, the 50-day at $115.44, and the 200-day at $116.17. That stacked arrangement is pure bearish setup. Daily RSI14 at 45.81 confirms momentum tilts negative, though the MACD histogram at 0.28 hints that selling pressure may be starting to lose some bite.
Intraday bounce shows cracks
The stock did bounce intraday, with an emerging stabilization signal on the one-hour chart. Price sits above the hourly 20 and 50-day moving averages but remains trapped below the 200-day at $112.78. That bounce, though, looks fragile. The 15-minute RSI hit 72.60, deep into overbought territory, which means the intraday move is stretched and vulnerable to reversal.
Tuesday's low of $108.56 tested the lower Bollinger Band at $108.46 before buyers stepped in to defend that zone. The range remains wide with ATR14 at 2.82, typical behavior for a stock digesting bad news before a major earnings report. The upper band sits at $115.82, which would need to break for any meaningful relief. For now, Walmart remains trapped between a daily structure pointing lower and a short-term bounce that looks increasingly overextended.
This analysis is informational only and does not constitute investment advice or a recommendation to buy or sell any security.