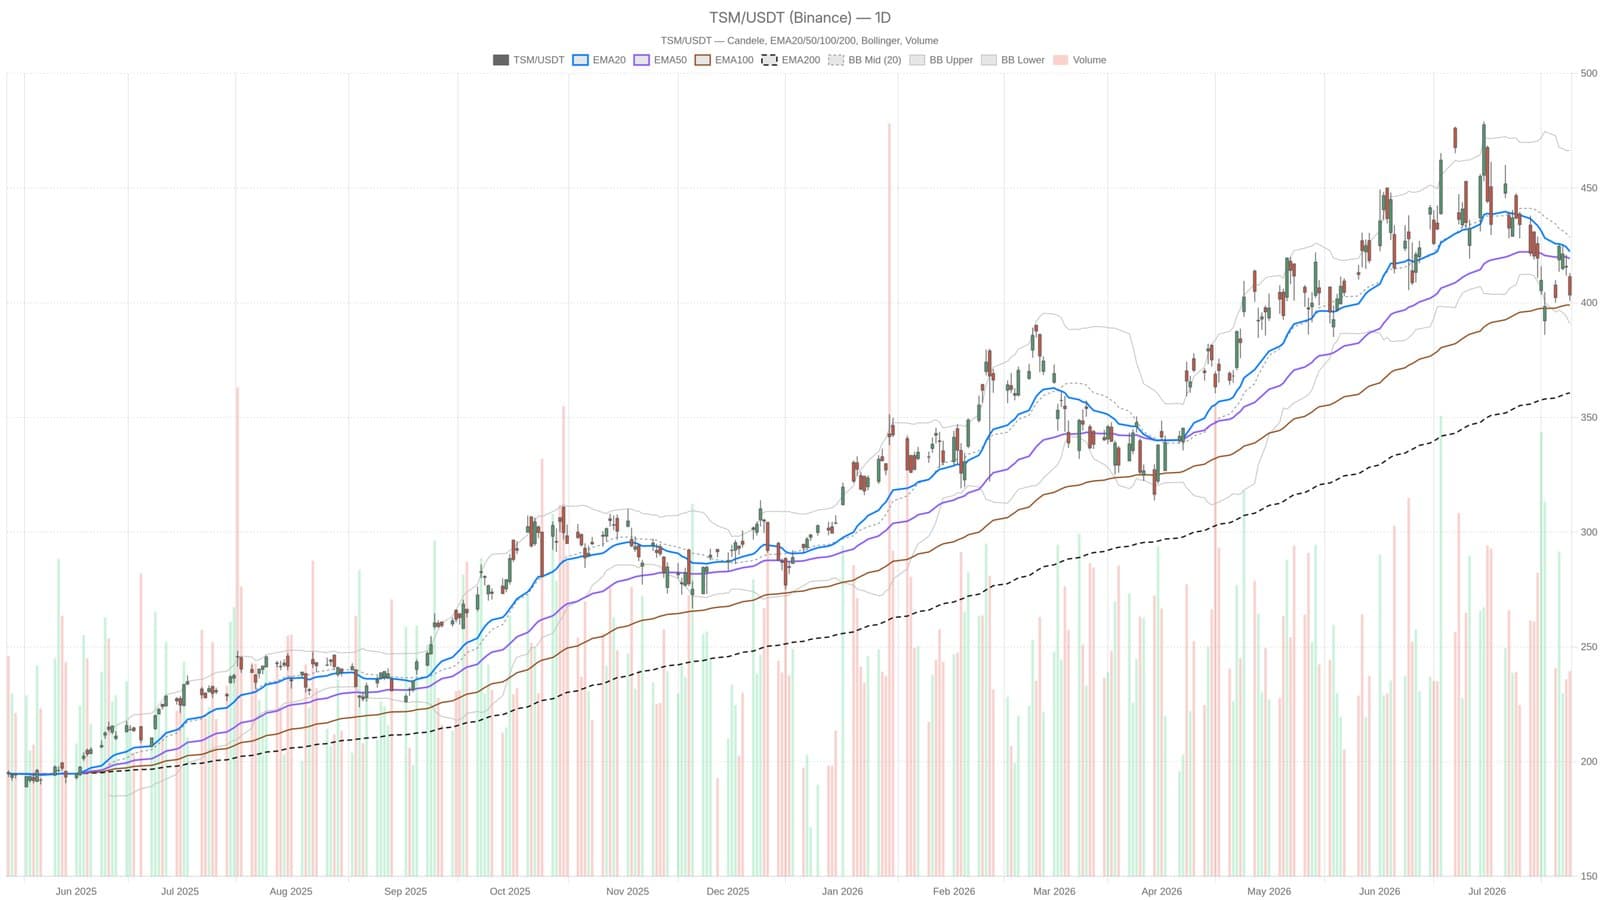
TSMC's stock closed at $403.41 on July 24, showing signs of weakening despite the company reporting record second-quarter earnings and announcing a hefty $100 billion capital expenditure plan in the U.S. This unexpected slide raises questions about market sentiment toward one of the semiconductor industry's key players.
Mixed Signals from Technical Indicators
The stock ended the day below its 20-day and 50-day exponential moving averages, at $422.30 and $419.29 respectively, signaling a loss of positive momentum. The daily MACD histogram is expanding on the downside, currently at -2.78, indicating accelerating selling pressure. Meanwhile, the RSI sits at 42.4, suggesting a mild bearish lean without reaching oversold territory. Price action shows a neutral stance with a bearish drift, lacking clear support levels.
On a shorter timeframe, hourly charts confirm a bearish trend as all key moving averages remain above the current price near $403.69, reflecting sustained selling pressure within the trading day.
TSMC’s strong fundamentals, including a raised outlook for 2026 and a substantial $100 billion investment in U.S. capacity, have not yet translated into stock price gains. The lower Bollinger Band at $390.81 marks the next potential downside target if the decline continues. Support at $398.50 is a critical level to watch.
With daily volatility measured by an average true range of $15.39, investors face notable intraday swings amid this technical weakness. TSMC’s situation contrasts with rising momentum in other chipmakers fueled by AI, such as Micron and SanDisk, highlighting a complex landscape in semiconductor equities.