Circle stock got punched around on August 5. The fintech company beat earnings expectations by 12.5 percent, yet missed revenue targets by 5.46 percent, leaving traders genuinely unsure which direction to push the stock. CRCL closed at 63.28 after bouncing off a low of 59.12, unable to hold onto an intraday peak of 64.20.
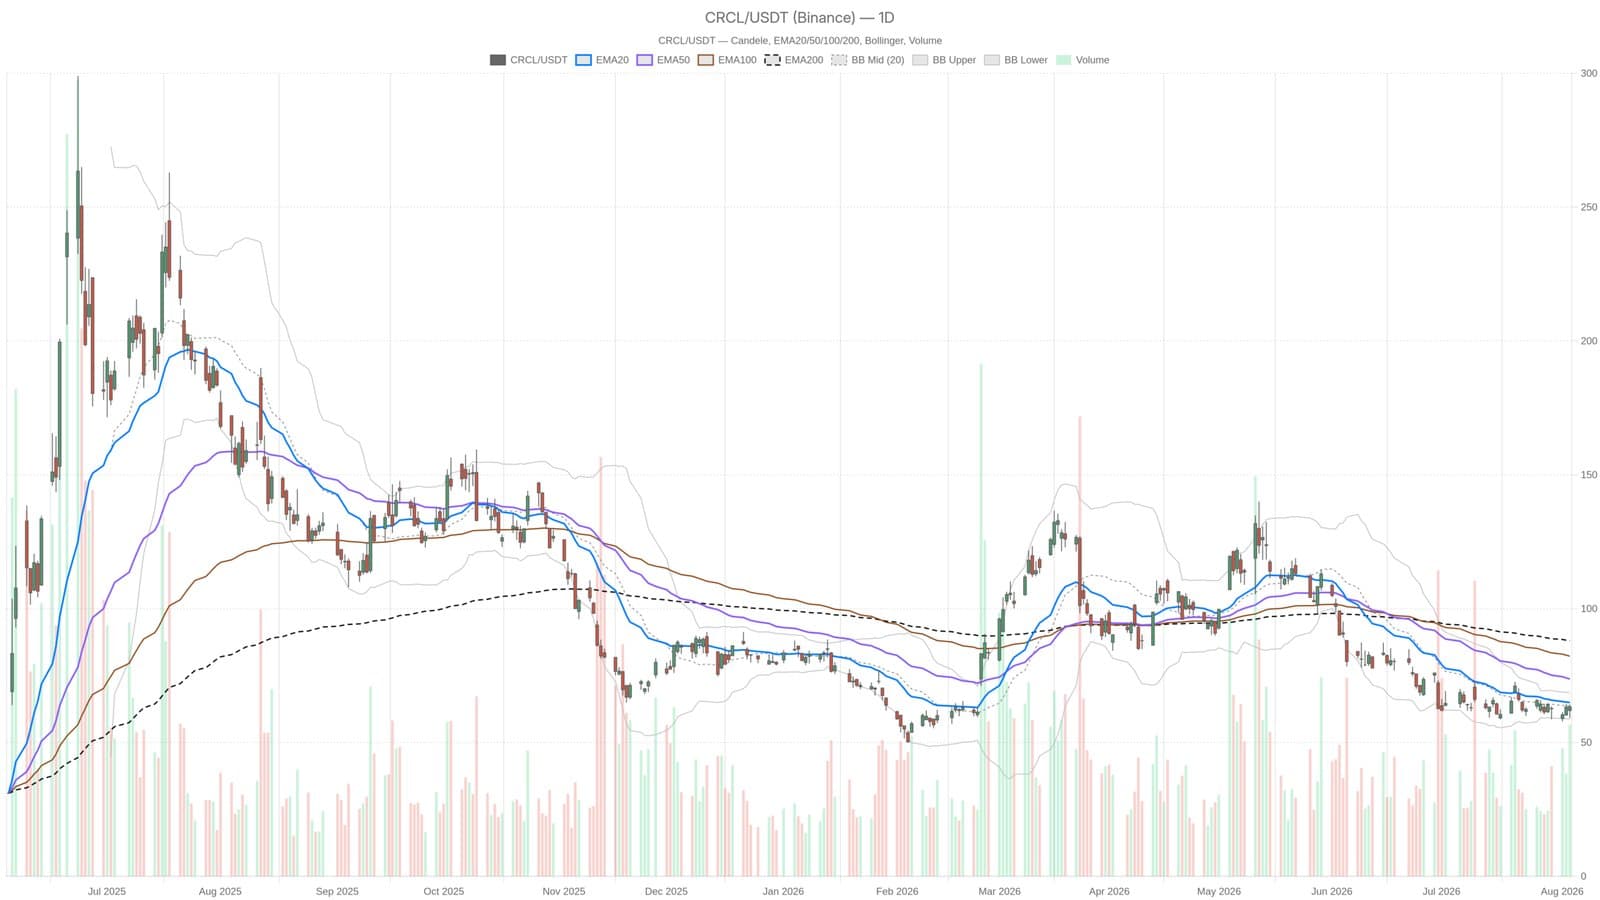
The daily chart tells a bearish story. Price sits below the EMA20 at 64.92, the EMA50 at 73.70, and well below the EMA200 at 87.98. That stacked alignment above the current price is textbook downtrend. Every attempt to rally into the mid-60s hits layered resistance instead of clean air. RSI14 sits at 45, neither oversold nor bullish, just neutral. MACD remains negative with the line at minus 3.15 below its signal, though the histogram turned positive at 0.80, signaling that downside momentum is weakening even if the trend hasn't reversed yet.
Shorter timeframes show tentative recovery
Zoom to the hourly and 15-minute charts and the picture shifts. Price sits above both short-term moving averages, creating what looks like a genuine bounce. The EMA200 on the hourly frame caps gains at 66.64, but the structure doesn't feel trapped. Volatility is running hot with ATR14 at 4.79, meaning daily swings of nearly five dollars are routine. Bollinger Bands show price near the midline at 63.72, upper band at 68.65, lower at 58.79, nothing extreme, just consolidation inside recent ranges.
Circle is planning the Arc mainnet launch for September 16. If that launch executes cleanly, it could provide the catalyst to break the daily downtrend. For now, traders are caught between a deteriorating daily structure and intraday signals that suggest the selling pressure is losing steam. The earnings miss on revenue was the original wound, but the beat on bottom line kept the stock from collapsing entirely.
This article is for informational purposes. It is not financial advice and should not be used as the sole basis for investment decisions.