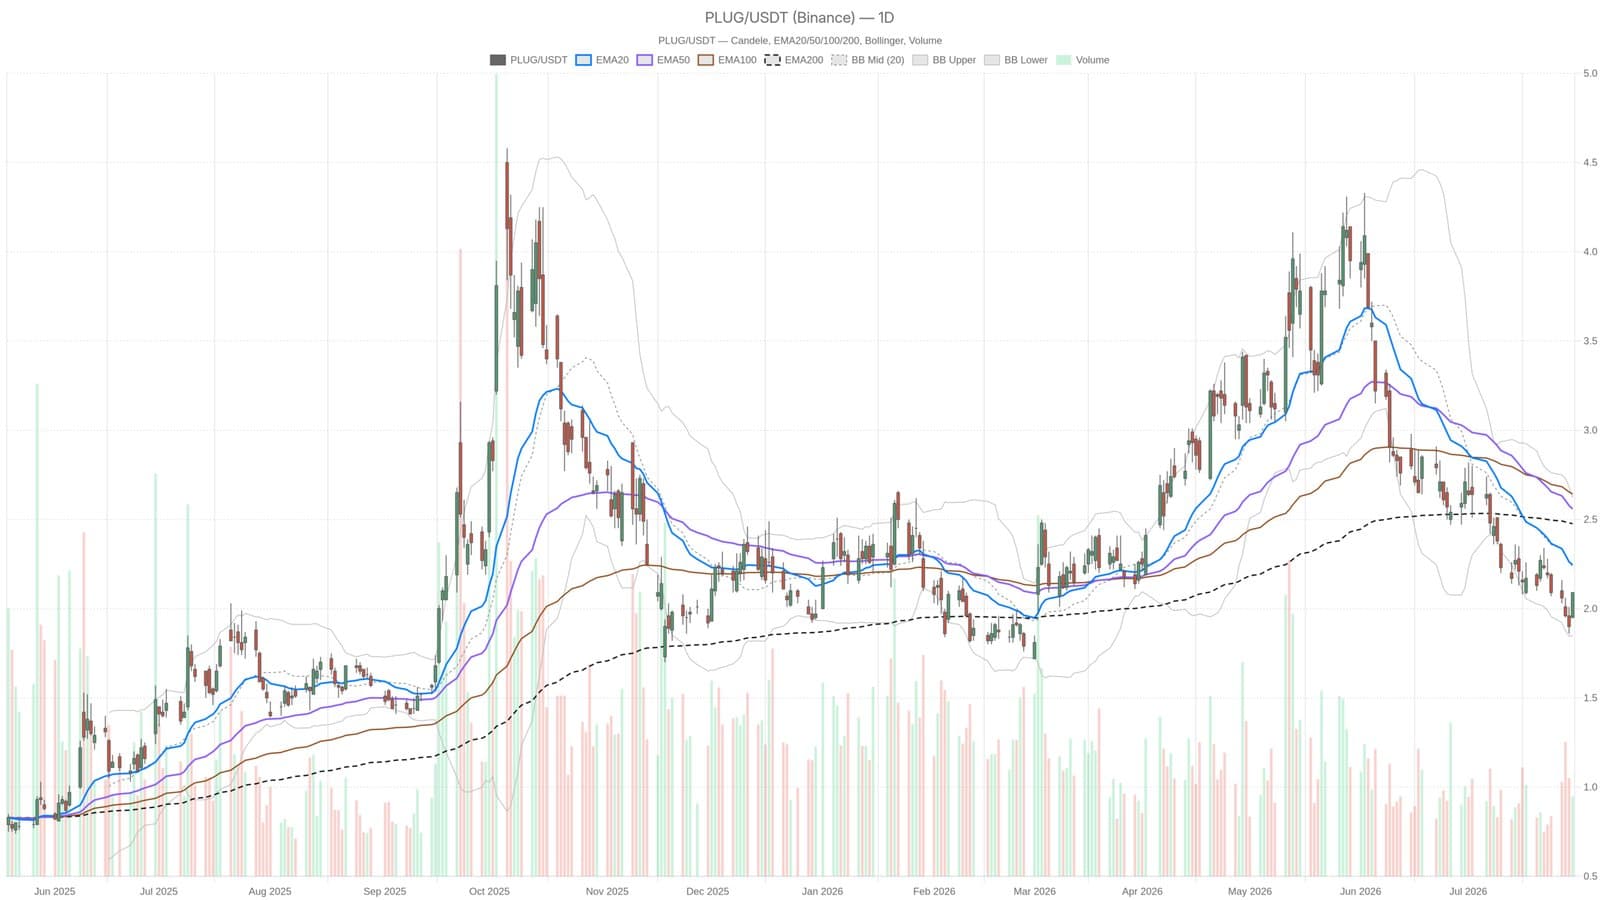
"We’re watching the $2 mark closely, but the bearish trend shows no signs of easing," said a market analyst tracking Plug Power’s performance. The stock closed at $2.09 on July 30, barely holding above the critical $2 support level after sinking 92.6% over the past five years. Despite hopes for a turnaround, the technical indicators paint a grim picture with the daily chart firmly bearish.
Plug Power's share price is trapped below all significant daily exponential moving averages EMA20 at $2.25, EMA50 at $2.56, and EMA200 at $2.48 signaling a persistent downtrend that stretches beyond a simple pullback. The stock currently trades in the lower third of its Bollinger Bands, with a midline of $2.24 and a lower band at $1.85. This setup reflects compressed selling pressure, reinforced by an average true range of $0.15, which shows moderate volatility but no explosive shifts that might hint at a sudden rebound.
Momentum indicators add to the cautious outlook. The Relative Strength Index (RSI) stands at 38.37, hovering near oversold territory but not quite there, indicating ongoing selling pressure without the exhaustion that often triggers contrarian buying. Meanwhile, the upcoming quarterly earnings and the effects of the Project Quantum Leap restructuring, including the sale of the Graham, Texas hydrogen project, could act as catalysts, pushing the stock either up or further down. However, a close below the $2 threshold could accelerate the decline towards the $1.85 Bollinger lower band.
Investors familiar with the broader tech and energy sectors might find parallels in other market moves. For instance, Robinhood’s recent slide amid falling crypto revenue highlights the volatility tech-related stocks face in uncertain markets. Plug Power’s future hinges on its ability to stabilize operations and convince investors that its ambitious restructuring can reverse years of decline.
This material is for informational purposes only and does not constitute financial advice.