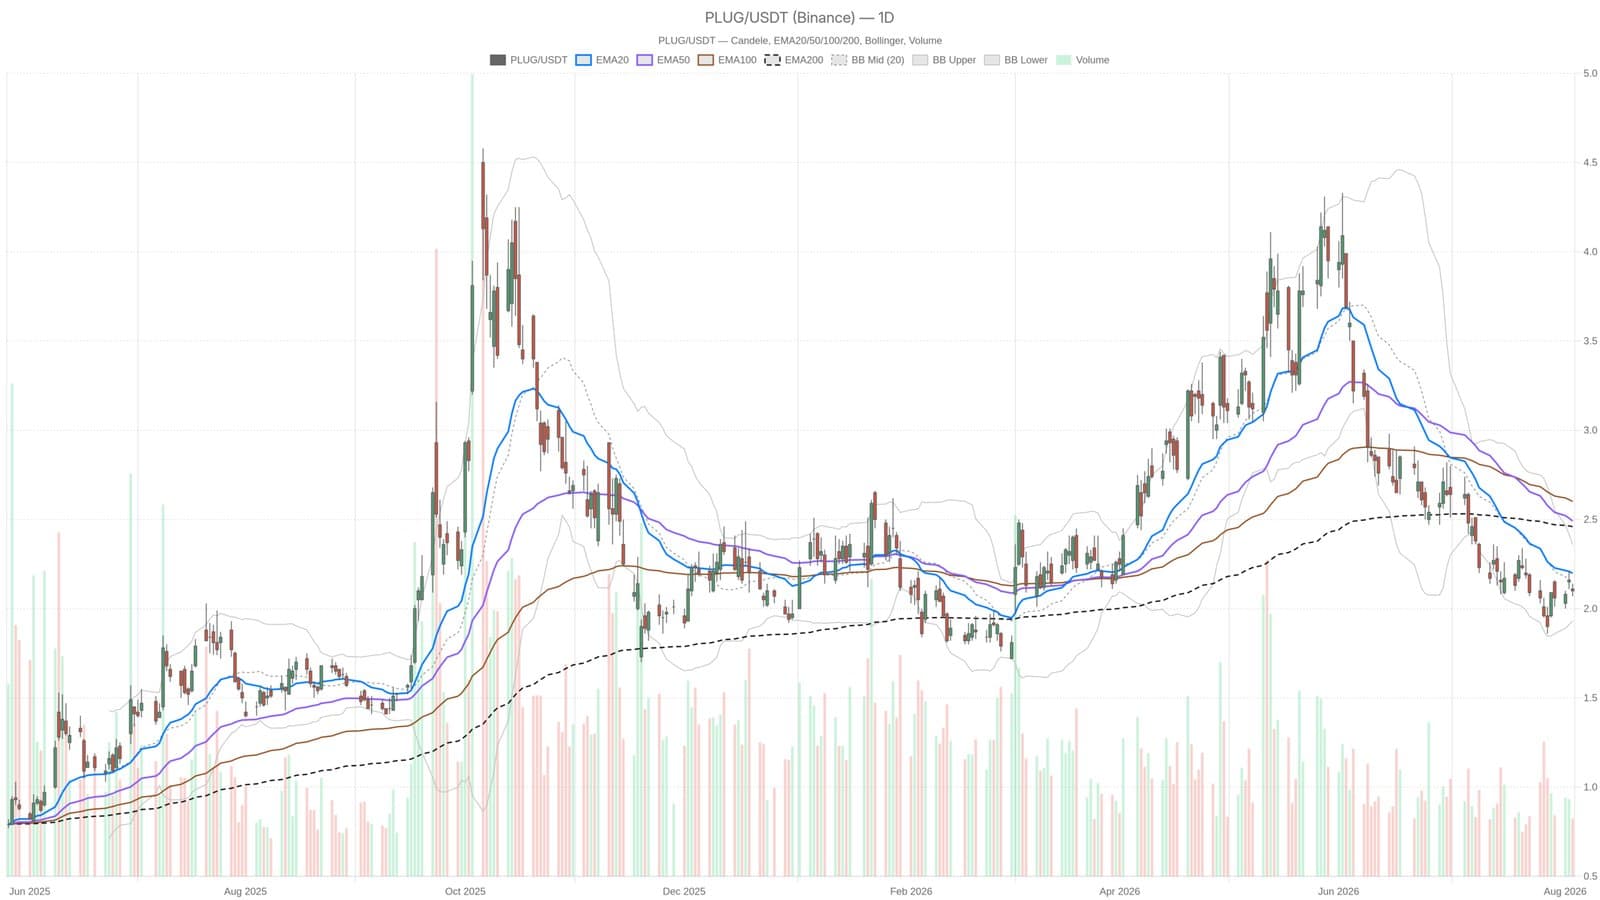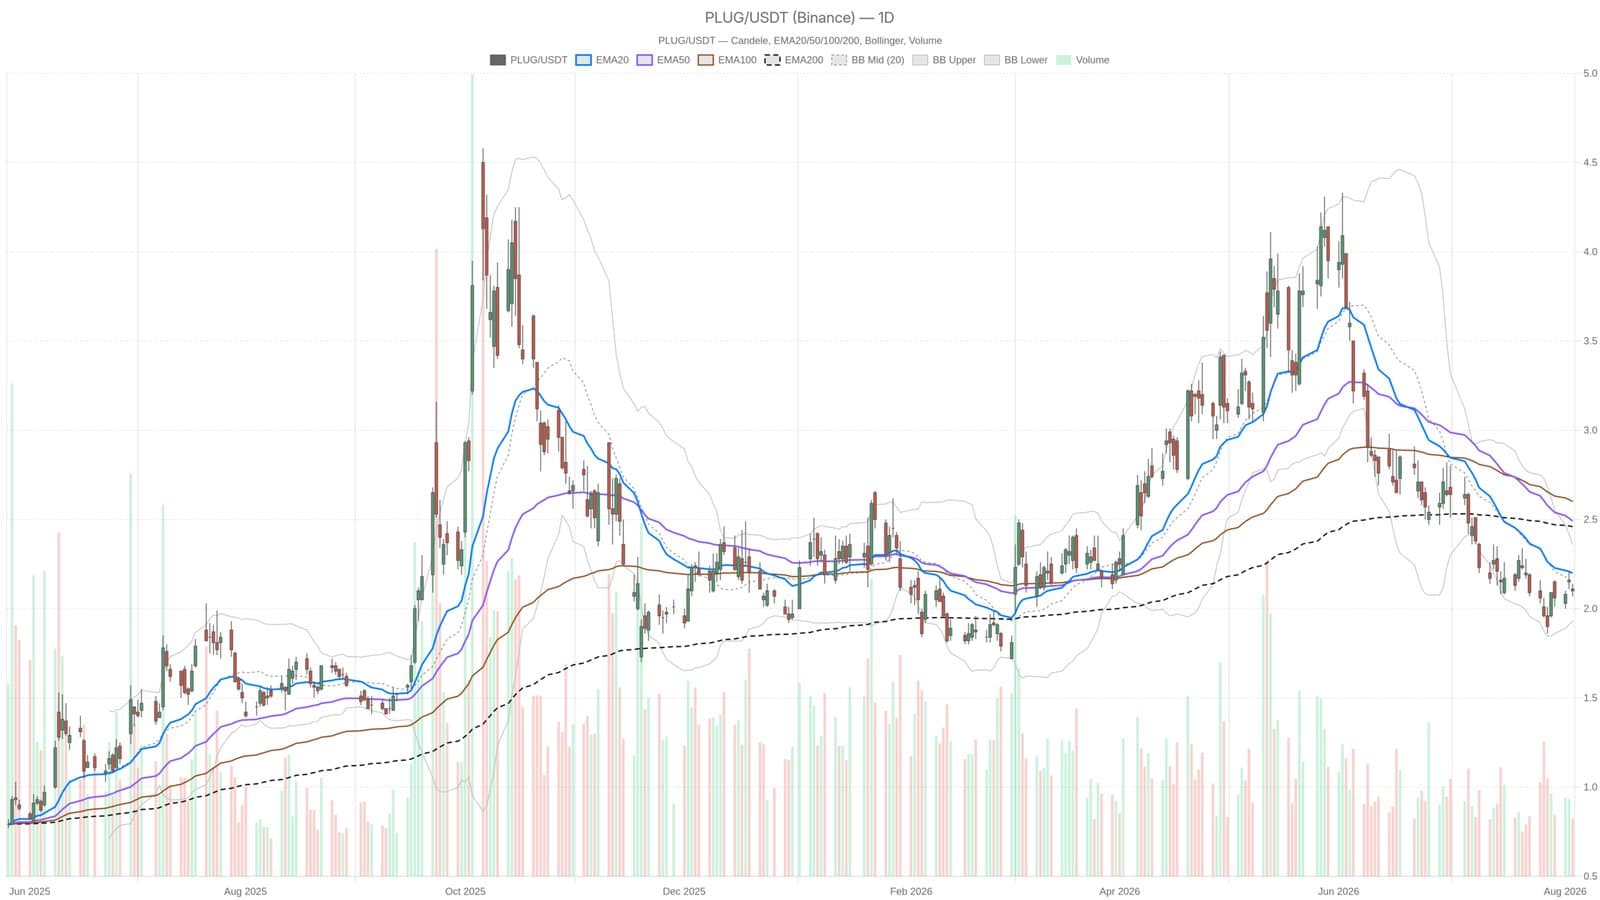
Plug Power shares closed at $2.10 on August 5, trading below all three major moving averages. The EMA20 sits at $2.20, the EMA50 at $2.49, and the EMA200 at $2.46. This stacked alignment is textbook bearish structure. Momentum has softened but hasn't collapsed yet. Volatility remains sharp ahead of the August 10 earnings report, with daily swings around 6% of price.
Daily Chart Signals Still Favor Sellers
The RSI14 reading of 40.66 sits below the neutral 50 line, confirming negative momentum without sliding into oversold territory. That leaves room for further downside before exhaustion typically shows up. The MACD has turned marginally positive in the histogram, suggesting sellers might be losing steam slightly, but the broader trend remains in their favor.
Bollinger Bands paint a picture of indecision. The mid-line rests at $2.15, with the upper band at $2.36 and the lower at $1.93. Price closed near the middle, showing no conviction in either direction. The Average True Range14 stands at $0.13, a meaningful swing on a $2.10 stock. Volatility is real and likely to spike once earnings numbers hit.
Earnings and Key Levels to Watch
August 10 is the key date. Pre-report analysis flags low beat probability, making this an event where the tape tends to move fast once the bell rings. Two levels matter most for the post-earnings direction. A decisive break above $2.14 would signal the start of something new. A drop below $2.07 would accelerate the selling. Anything in between keeps traders guessing.
Hourly consolidation near $2.09 $2.10 hasn't reversed the downtrend. Until price clears one of those thresholds, the bearish alignment on the daily holds. Traders with positions should watch the earnings call closely, not just the headline numbers.
This analysis is informational only and does not constitute financial advice or a recommendation to buy or sell securities.