Pfizer shares closed at $25.03 after the company lifted its full-year revenue guidance, landing in a narrow zone where bulls and bears remain locked. The stock sits above the 20-day moving average but still trapped below longer-term resistance, creating a fork in the road ahead of Q2 earnings.
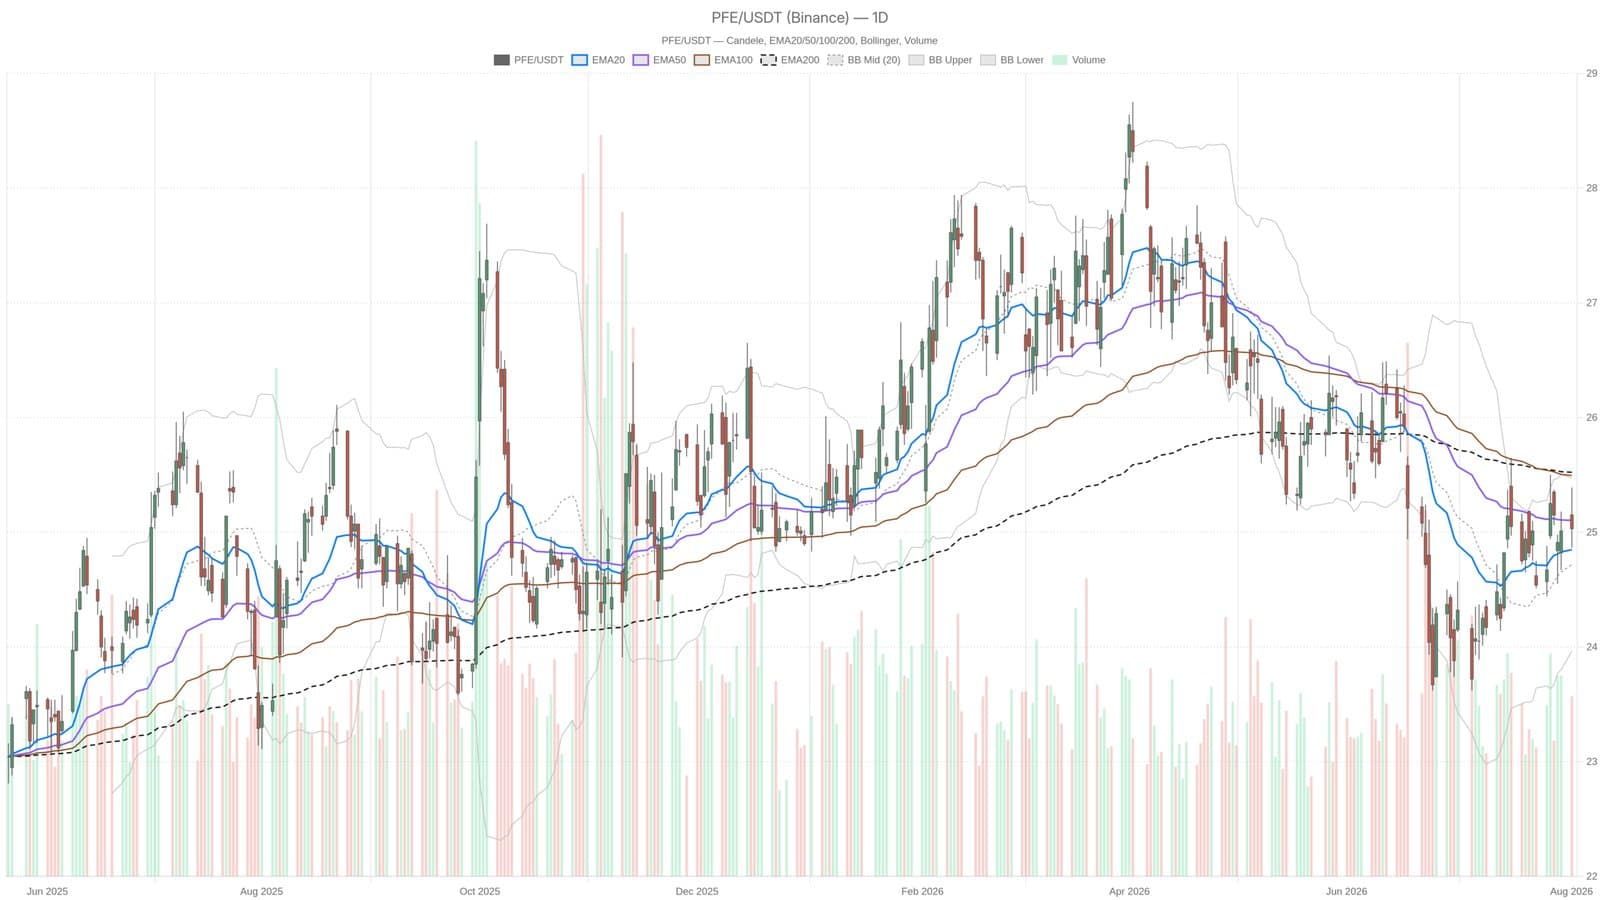
The technical picture splits across timeframes. On the hourly chart, three moving averages stack bullishly with price comfortably above all of them. But the daily view tells a different story. Pfizer trades above the 20-day EMA at $24.85 yet remains pinned below the 50-day EMA at $25.10 and the 200-day EMA at $25.52. That layering matters. The longer-term averages are acting as a ceiling, keeping the daily regime neutral rather than trending higher.
Momentum signals show early cracks in the resistance. The daily RSI14 sits at 52.57, right in the middle with no extreme readings. More interesting is the MACD histogram, which just flipped positive at 0.07. The MACD line at 0.04 has crossed above the signal line at -0.04. It's not a screaming buy signal, but it suggests daily momentum is starting to edge upward even if the broader trend hasn't confirmed yet.
Where the Real Test Sits
Immediate support holds at $24.80. A break below that opens the door to $24.30 and deeper losses. On the flip side, a clean move above $25.33 would finally align the daily structure with the bullish setup visible on the hourly chart. Bollinger Bands show Pfizer trading in the upper half of the range, closer to the upper band at $25.47 than the midline at $24.72. There's room to run before the stock becomes technically stretched.
The revenue guidance hike was the catalyst. Pfizer raised the midpoint of full-year expectations just as it heads into earnings, which typically forces options traders and algorithmic systems to recalibrate. Average True Range at 0.51 suggests moderate volatility, meaning moves are possible without needing a shock to happen.
The next few days matter. If Pfizer breaks $25.33 with volume, shorts covering could accelerate the move. If it rolls over from resistance, the stock risks sliding back to $24.80 and testing whether that floor holds. The hourly bulls have momentum, but they need the daily chart to flip before this becomes a genuine uptrend rather than a dead-cat bounce.
This is technical analysis for educational purposes only, not a recommendation to buy or sell. Always consult a financial advisor before making investment decisions.