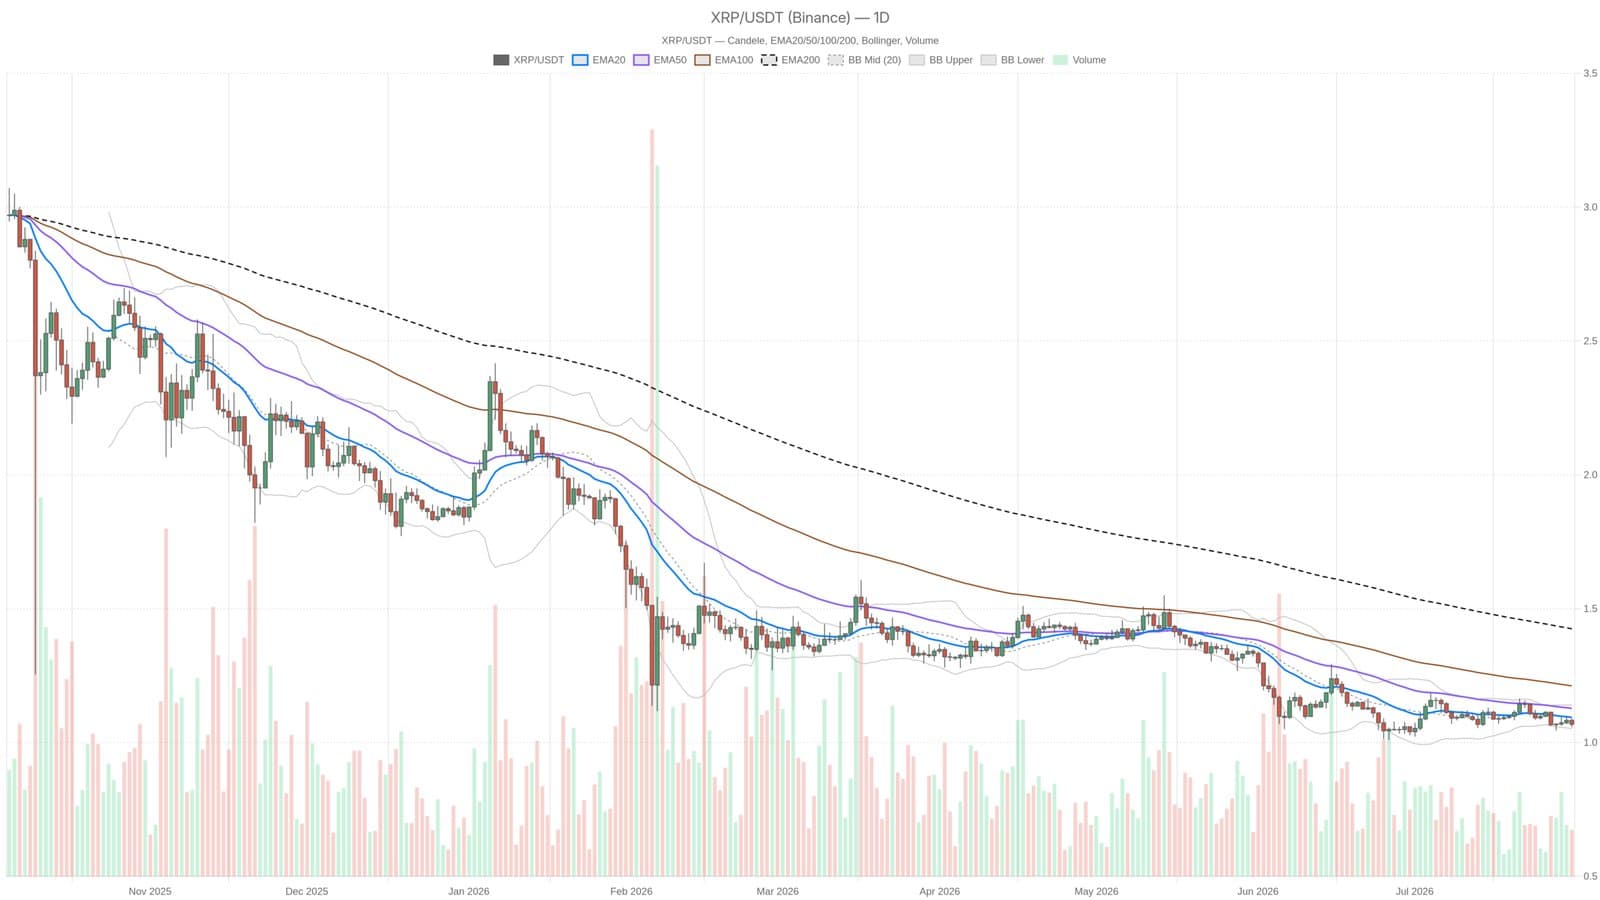
XRP is struggling to stay afloat at $1.07, trading under all major moving averages. The digital asset has lost steam as it sits below the 20-day EMA at $1.09, the 50-day EMA at $1.13, and the 200-day EMA at $1.42. This bearish formation highlights that investors who jumped in during the recent rally are now facing losses, pushing the price toward further downside risk.
Technical Indicators Point to Continued Pressure
The Relative Strength Index (RSI) at 42.47 reflects ongoing weakness without entering oversold territory, suggesting sellers still control the market but a rebound isn’t imminent. The MACD lines hover near zero, signaling exhaustion rather than a clear reversal opportunity. Meanwhile, the Bollinger Bands frame XRP’s price with a midline at $1.10 and a lower band at $1.05, marking critical support to watch closely.
Volatility remains muted, as the Average True Range (ATR) measures just $0.03, restricting sharp moves in either direction. The Fear & Greed Index sits at 25, indicating extreme fear, while Bitcoin dominance climbs to 56.23%, further weighing on altcoins like XRP.
Support and Resistance Levels to Monitor
Key levels are converging near $1.05, which acts as key support, while resistance forms around $1.09, aligned with the daily 20 EMA and hourly 200 EMA. Breaking below $1.05 could open the door for deeper losses, potentially dragging XRP lower amid the prevailing downtrend.
With technical signals confirming a lack of buyer interest and broader market fear rising, XRP faces an uphill battle to regain footing. Traders will be watching these levels closely for signs of either a breakdown or a recovery attempt.
This content is for informational purposes and does not constitute financial advice.