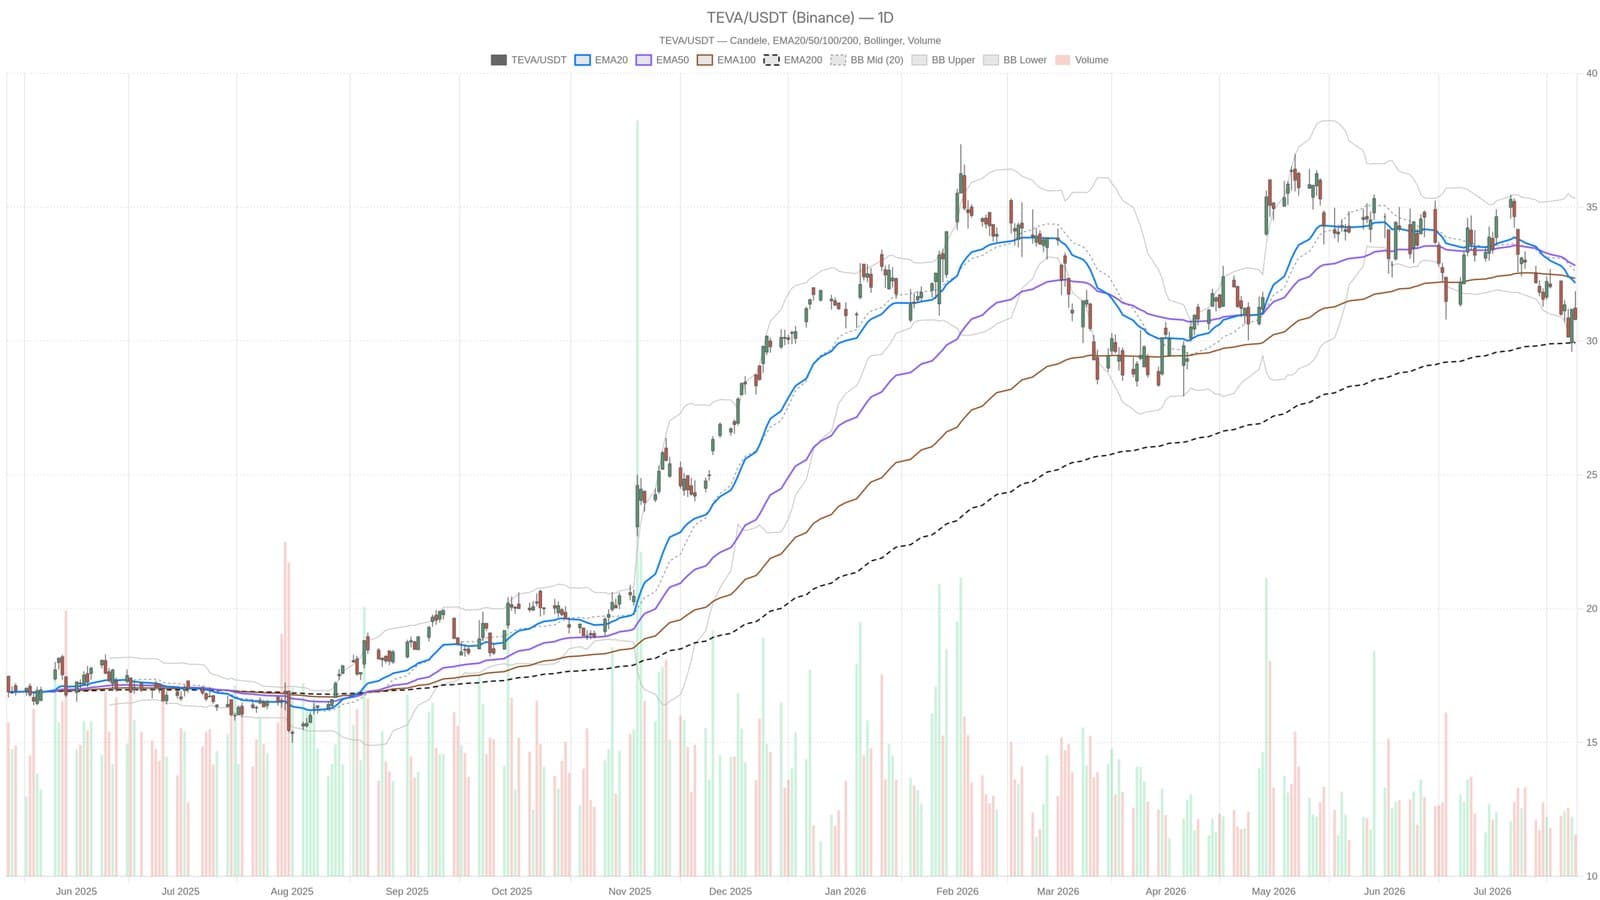
Teva Pharmaceutical Industries closed at $30.81 on July 24, staying below critical daily moving averages, setting a cautious tone despite bullish analyst forecasts. Wall Street experts maintain a full buy rating on the stock with price targets indicating more than 60% upside potential, yet the technical charts suggest otherwise.
The stock trades under the EMA20 at $32.17 and EMA50 at $32.81, with the EMA200 at $29.94 being the essential support level. Indicators reflect a fragile situation: the daily RSI holds at 40.15, highlighting weak momentum but not yet oversold conditions, while the MACD confirms ongoing downward pressure with a negative histogram of -0.21.
Price action presses toward the lower Bollinger Band at $29.87, warning of potential further declines if breached. Daily pivot points reinforce this resistance area, with the price closing just beneath the $31.15 pivot, signaling subtle selling influence. Intraday charts echo the bearish sentiment: the one-hour timeframe displays price below all key moving averages, facing layered resistance from the hourly EMA50 at $31.29 and EMA200 at $32.56.
Still, there is a faint signal of easing selling pressure as the hourly MACD histogram shows slight positive divergence at 0.06. While the strong buy rating from analysts suggests confidence in Teva’s recovery, the technical picture demands vigilance for investors eyeing this stock’s short-term movements.