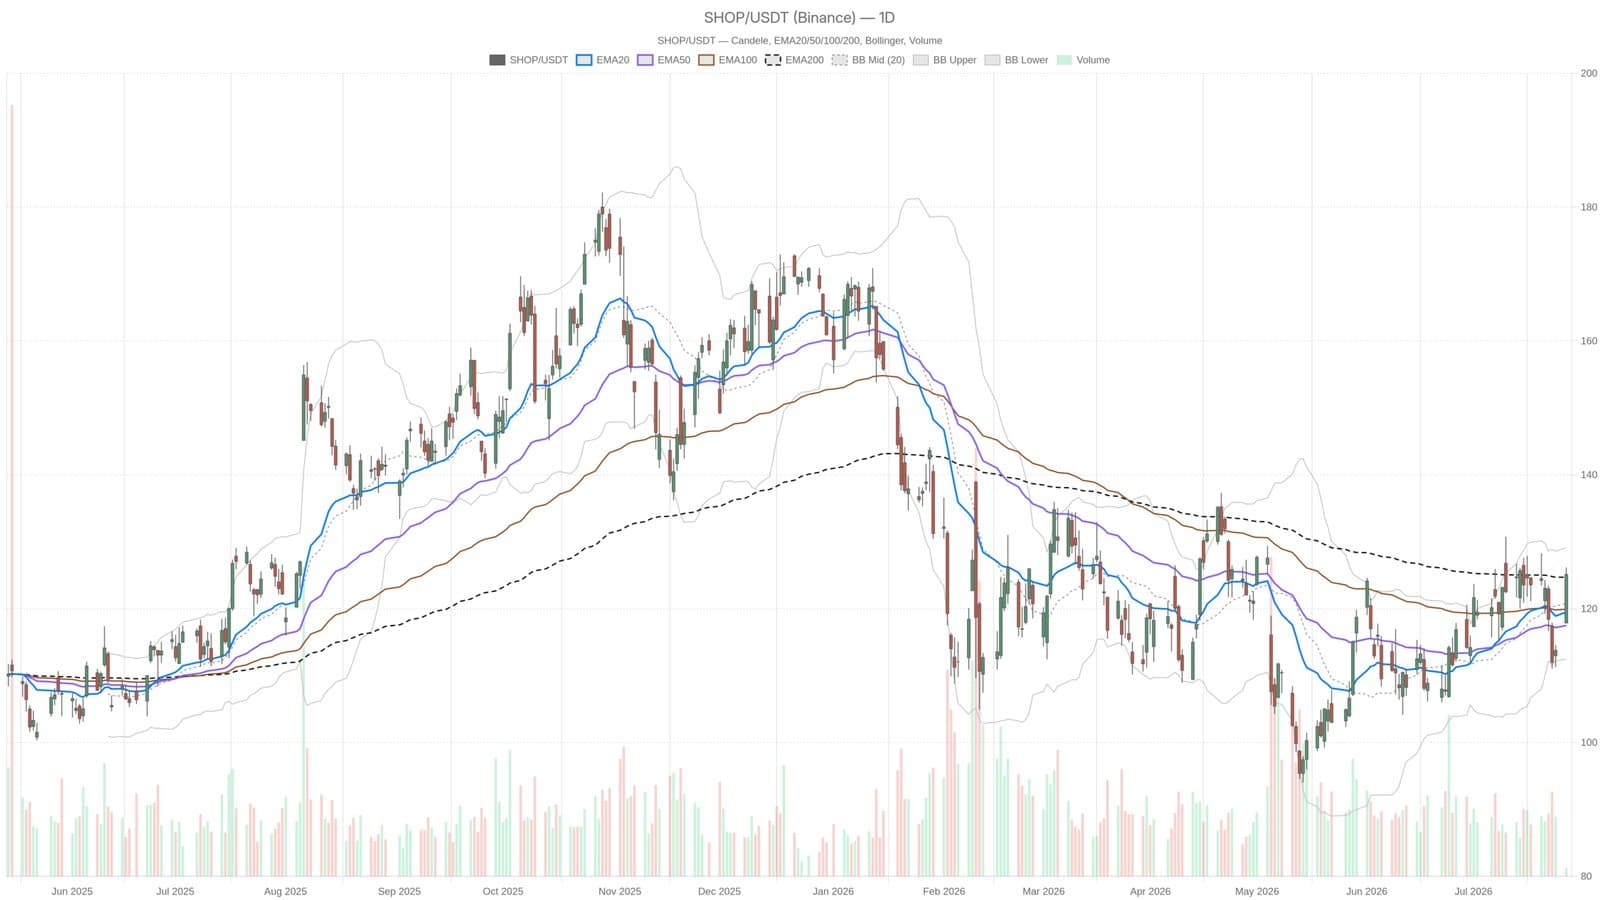
Shopify shares jumped from $117.86 to close at $125.10 on July 27, hitting an intraday peak of $126.17. This $8.36 range marked a key moment as the stock pushed against the long-standing resistance of the daily EMA200, set at $124.70.
While the price breakout suggests strength, the momentum indicators tell a more cautious story. The daily RSI at 57.53 points to moderate bullishness but stays clear of overbought levels. At the same time, the MACD histogram at -0.76 signals momentum is losing steam despite higher prices, hinting that buying pressure is waning.
On shorter timeframes, the situation looks more stretched. The hourly RSI is at 69.99, nearing overbought territory, and the 15-minute RSI has surged to 74.97, firmly in overbought zones. This could mean a short-term pause or pullback is coming soon.
Shopify now faces a test over the next few days: holding daily closes between $124.70 and $126.17 will be key for confirming if the medium-term bullish trend has staying power. The next resistance on the horizon is near the upper Bollinger Band at $129.10, while volatility, measured by the ATR14 of $6.39, remains elevated enough to shake out weaker hands.