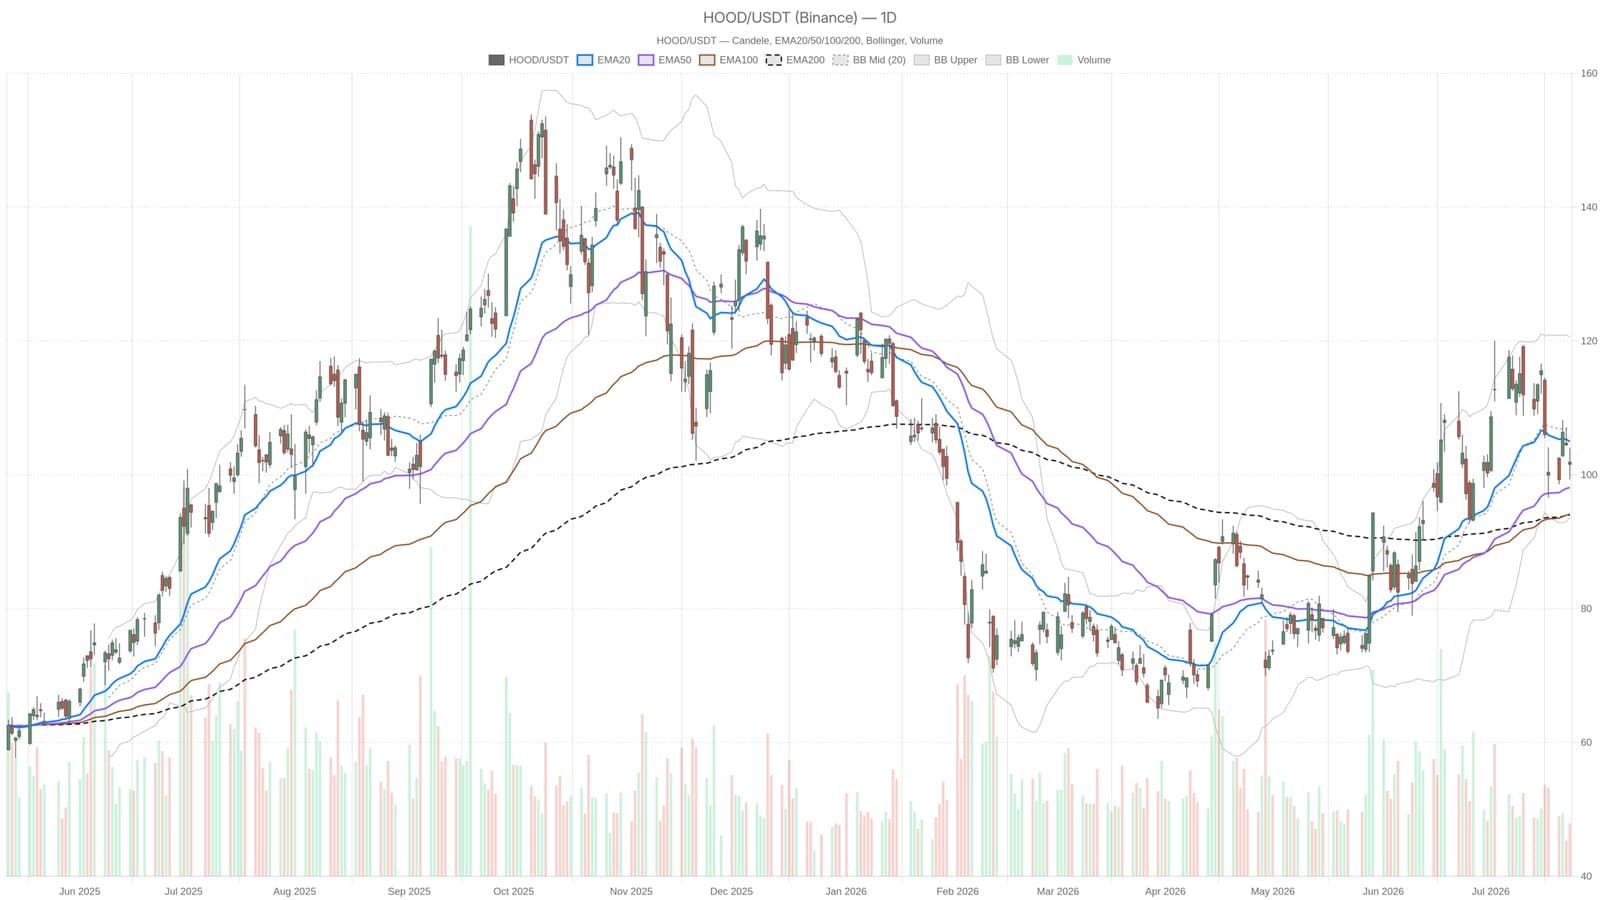
Robinhood's stock displayed a sharp 9.2% expected price swing as investors brace for the earnings announcement scheduled for July 29. On July 23, the shares closed at $101.58, almost exactly matching the daily pivot level of $101.67, indicating a delicate balance in the market.
Technically, the medium to long-term outlook holds some bullish signals with the price comfortably above the 50-day and 200-day moving averages, set at $98.10 and $93.99 respectively. This suggests foundational support remains firm. Yet, momentum has waned as the stock price now sits below the 20-day average of $104.96, and the daily MACD indicator recently showed a bearish crossover, signaling weakening near-term buying interest. The RSI hovered near 48.2, pointing to a neutral stance where neither buyers nor sellers dominate decisively.
Bollinger Bands present a broad trading range stretching from a lower boundary near $93.69 to an upper limit around $120.63, supported by an average true range of $6.32. Such data imply that Robinhood shares could witness significant moves in either direction depending on catalysts during earnings week.
Intraday Trends Suggest Caution
The hourly charts lean toward a short-term decline. Current prices trade below important short-term moving averages, including the EMA20 at $103.54 and EMA50 at $105.40. This stacking pattern points to persistent downward pressure within the day, while the MACD on this timeframe confirms the buildup of bearish momentum rather than exhaustion.
Adding to the narrative, analysts highlight that Robinhood’s prediction market segment may surpass crypto revenue in Q2, potentially shifting investor focus and reshaping company valuation. As earnings approach, this factor could inject additional volatility.
Investors should watch the price action closely as options markets have priced in a move of about $9 in either direction, reflecting the market’s uncertainty.