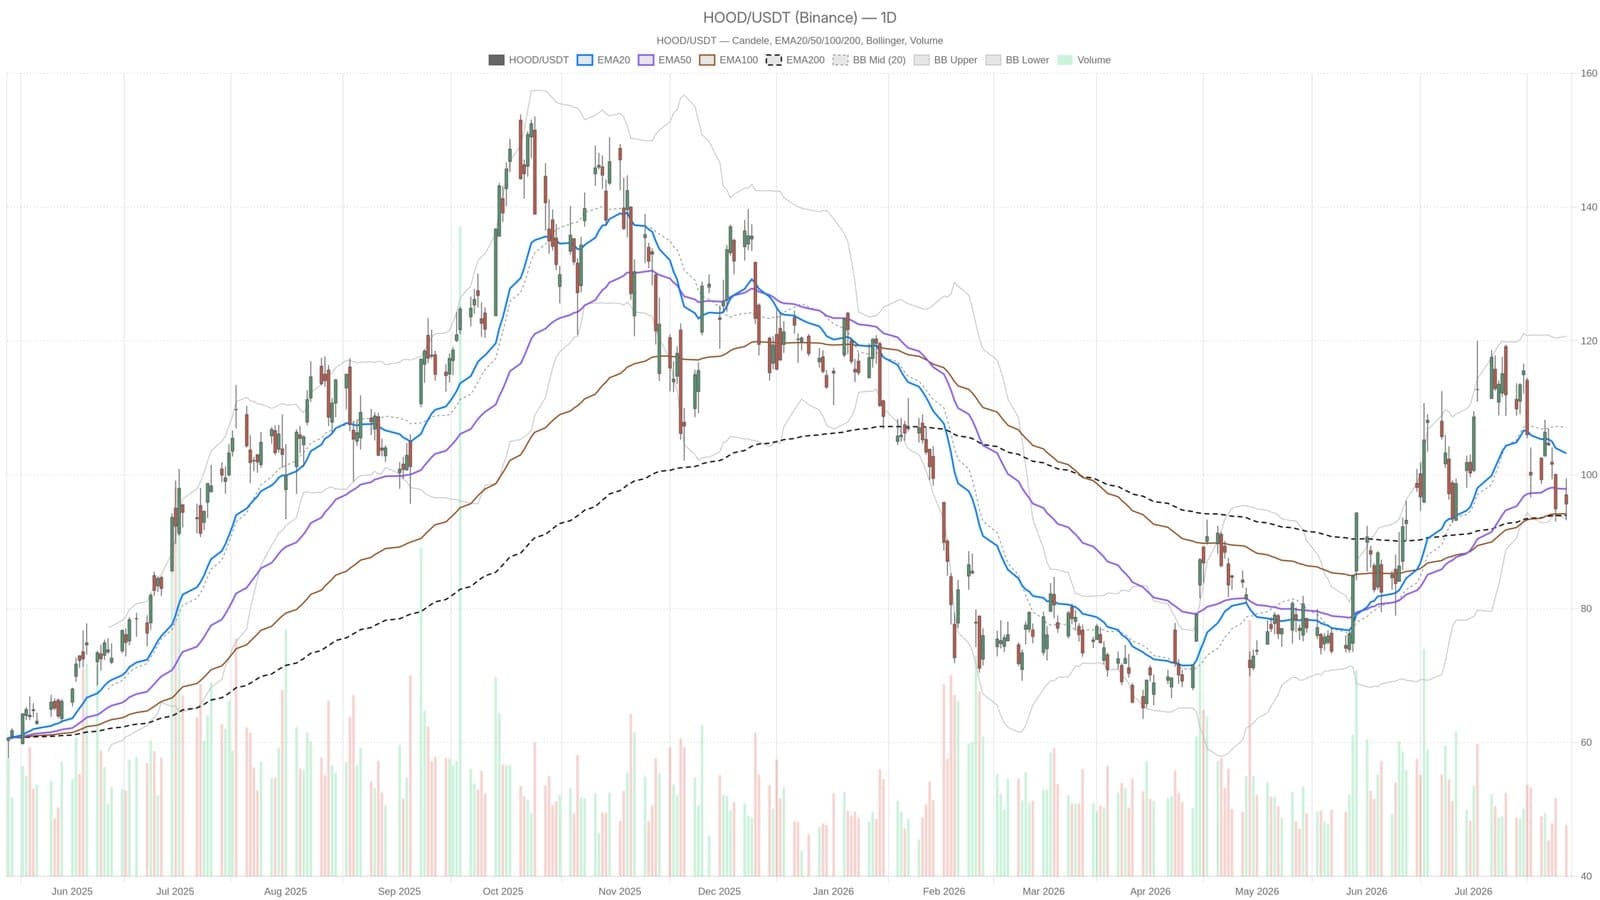
Robinhood stock slipped to $95.65 on July 27, trading below key moving averages as investors brace for the upcoming Q2 earnings report. Despite hitting $600 million in chain deposits last week, signaling increased blockchain activity, the stock faces persistent selling pressure heading into the July 29 announcement.
Technical Signals Point to Weakness
The stock closed beneath both its 20-day EMA at $103.20 and 50-day EMA at $97.88, suggesting a fragile technical setup. Indicators support this bearish tone: the 14-day RSI stands at 43.24, under the midpoint and trending downward, while the MACD histogram is at -2.49, reflecting strengthening downside momentum. Price action hovers near the lower Bollinger Band at $93.44, placing shares in the lower range of recent volatility, which might attract contrarian traders. However, a break below critical support levels could accelerate the decline.
Support Levels and Potential Breakdowns
The 200-day EMA at $93.92 currently represents a key support level for Robinhood shares. If the stock drops below $92.75, it would signal a structural breakdown and potentially open the door to further losses. On the hourly chart, the situation appears even bleaker. The price trades below the 20-, 50-, and 200-hour EMAs, forming a bearish alignment that heightens short-term risks. Volatility remains elevated with the ATR14 reading $6.48, which could lead to bigger swings around the earnings release.
Robinhood’s mixed signals blockchain deposits surging by 50% in just one week but technical indicators weakening create an uneasy outlook. Investors will be watching the earnings closely to see if the company can use its blockchain growth to offset the stock’s technical challenges.
This material is informational and not financial advice.