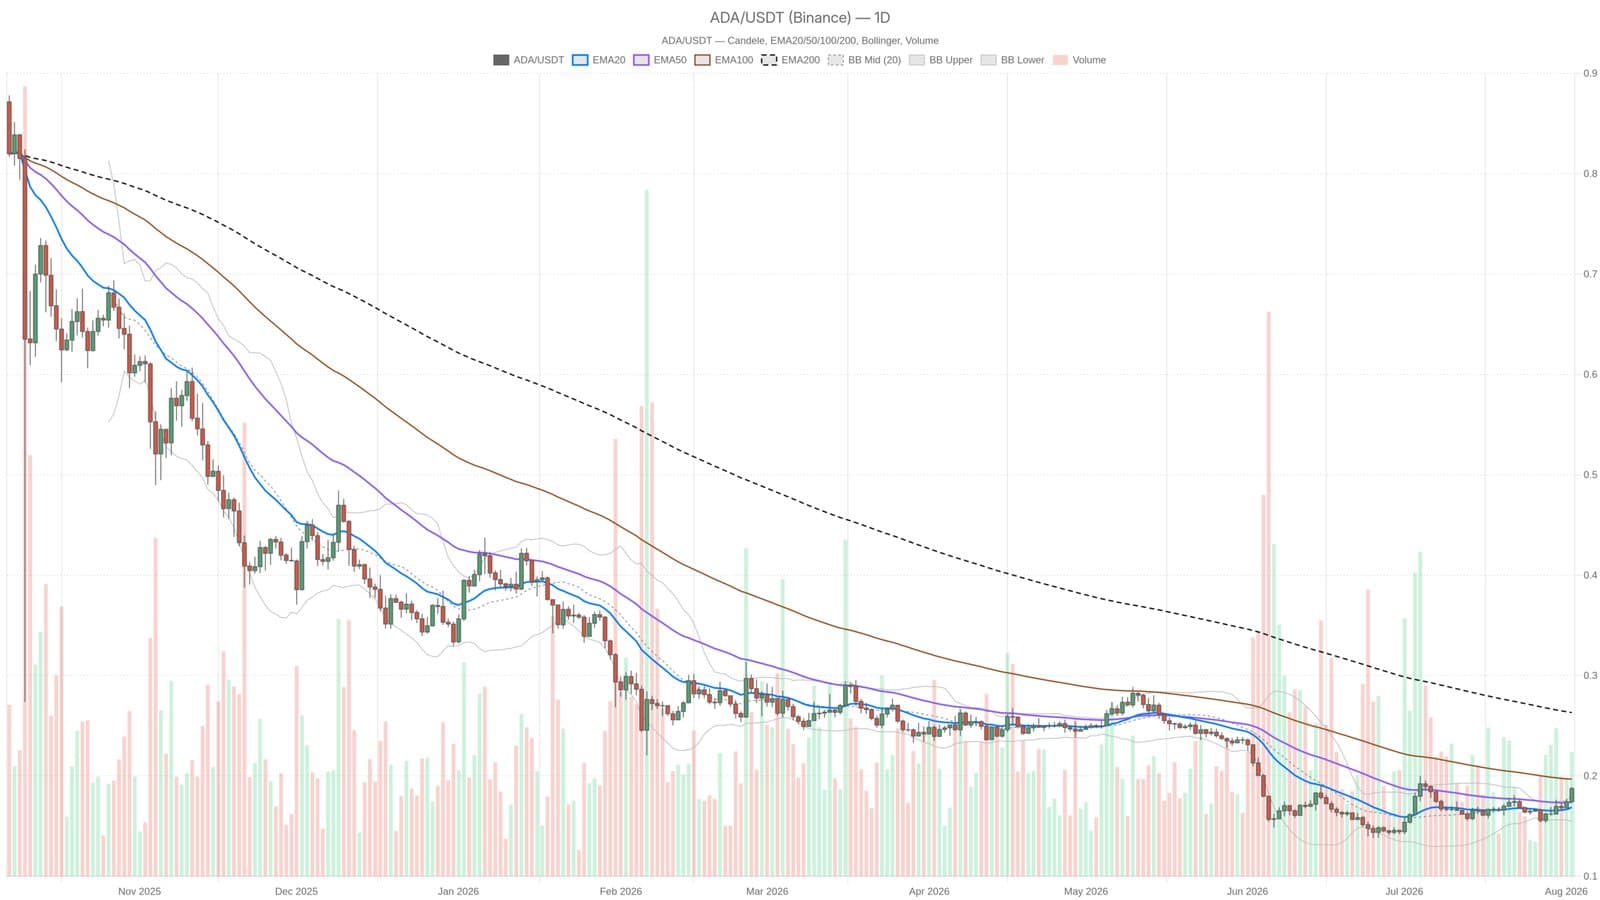
On August 2, 2026, Cardano's ADA price hovered near $0.19, revealing a tug-of-war between different timeframe signals.
While the daily chart remains mostly flat and cautious, shorter intervals like the 1-hour and 15-minute charts flash a bullish tone, suggesting a potential breakout ahead.
The Fear & Greed Index stands at 27, indicating widespread market fear that contrasts sharply with ADA's short-term strength. This disconnect often preludes volatile moves, as market participants reassess positioning.
Fees on Minswap DEX, Cardano's largest decentralized exchange, dropped 44.54% in the past week, pointing to cooling activity in the DeFi sector on the network.
Bitcoin dominance holds firm at 56.25%, limiting the rotation into altcoins like ADA and creating headwinds for its outperformance.
Volatility measured by the 14-day ATR is compressed at 0.01, a pattern that frequently precedes sharp directional shifts rather than sideways drifting.
Looking at the daily chart, ADA trades just above its 20- and 50-day EMAs at $0.17, a modestly positive sign, but the 200-day EMA remains at $0.26, far above the current price. This gap signals the broader downtrend has yet to be broken.
The daily RSI at 64.86 shows steady buying interest without hitting extreme overbought levels, unlike the shorter timeframes that already indicate overbought conditions.
The tension between the intraday bullish momentum and overall market fear suggests the next few trading sessions could deliver a decisive move, clarifying whether ADA's rally can sustain or will falter amid broader risk aversion.
This content is for informational purposes only and should not be considered financial advice.