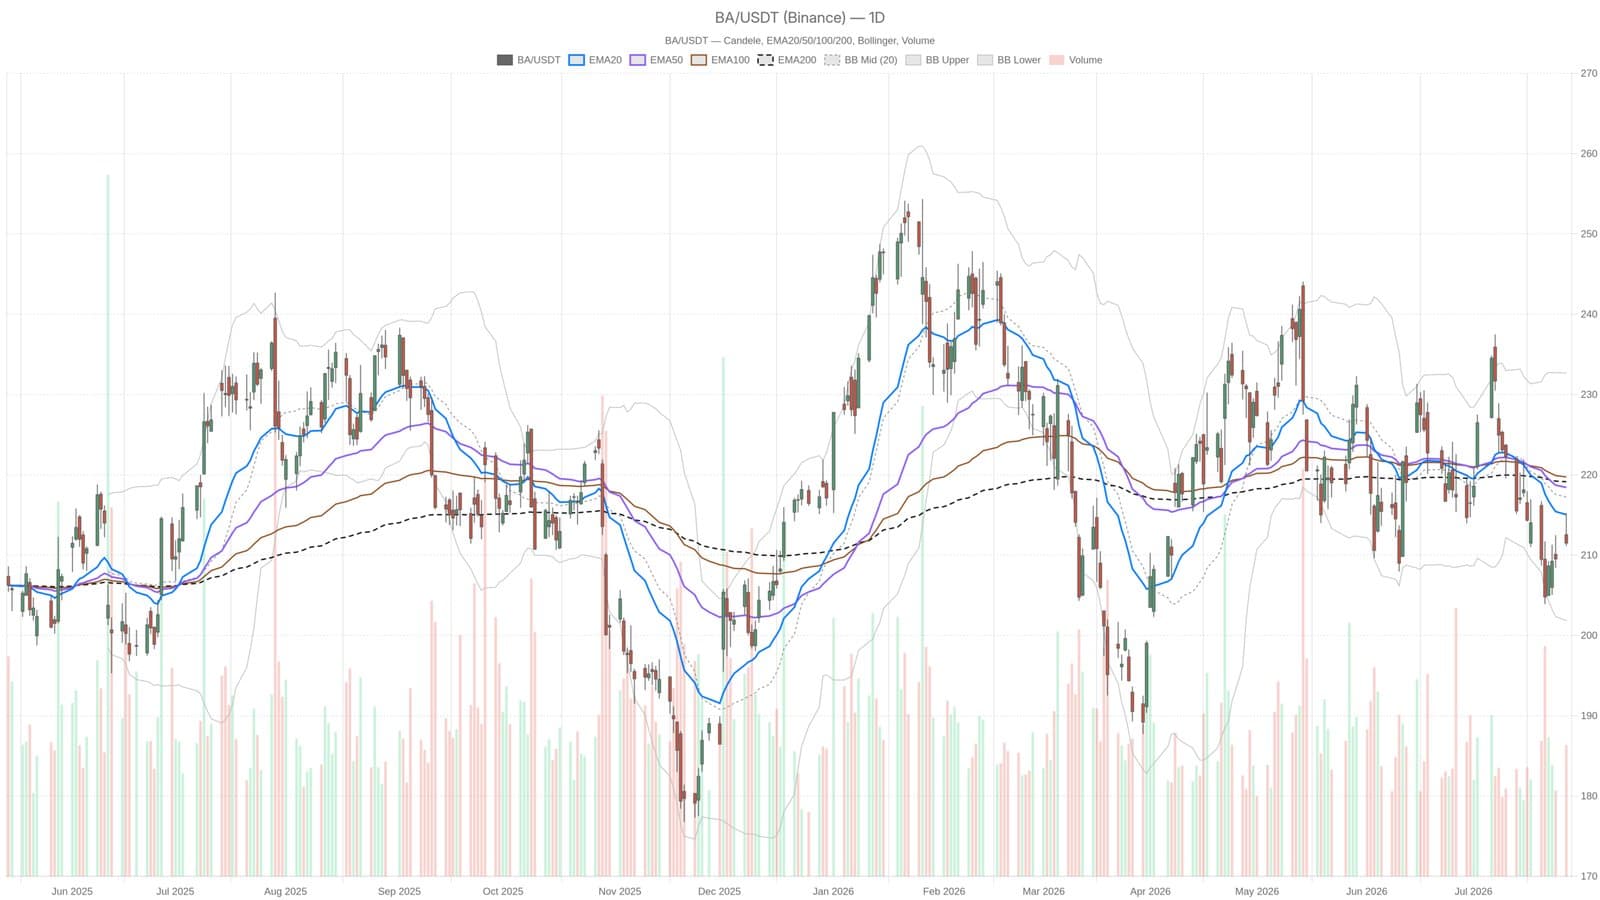
Boeing's stock closed at $211.50 on July 27, sitting well below critical moving averages that traders watch closely. The 20-day EMA stands at $215.05, the 50-day EMA at $218.43, and the 200-day EMA at $219.14. This gap signals persistent selling pressure that’s been building for weeks rather than a sudden drop. Momentum indicators shows the bearish mood, with the MACD at -3.32 and a negative histogram confirming the downward trend shows no sign of easing. Meanwhile, the RSI at 43.98 implies there’s still room for the stock to fall further before buyers step back in.
Technical Signals Point to Further Decline
Boeing’s daily chart paints a clear picture of weakness, as prices remain stuck below all major EMAs. The Bollinger Bands place the current price in the lower half of the range, with the lower band at $201.83 potentially acting as a floor if selling intensifies. Support level S1 at $210.03 also stands out as a near-term benchmark to watch. These technical cues suggest the stock could face continued downside unless momentum shifts dramatically.
Upcoming Earnings and CEO Comments Could Shift Sentiment
The market’s next major catalyst comes with Boeing’s Q2 earnings release and comments from CEO Kelly Ortberg regarding 737 MAX production, scheduled for Tuesday. Investors will be closely examining any updates for signs of improvement or further struggles. Boeing’s recent trends resemble challenges seen in other sectors, such as chipmakers facing downturns, similar to the AMD stock pressure earlier this year. How Boeing navigates these developments will likely set its trajectory for the near term.
This article is for informational purposes only and does not constitute financial advice.