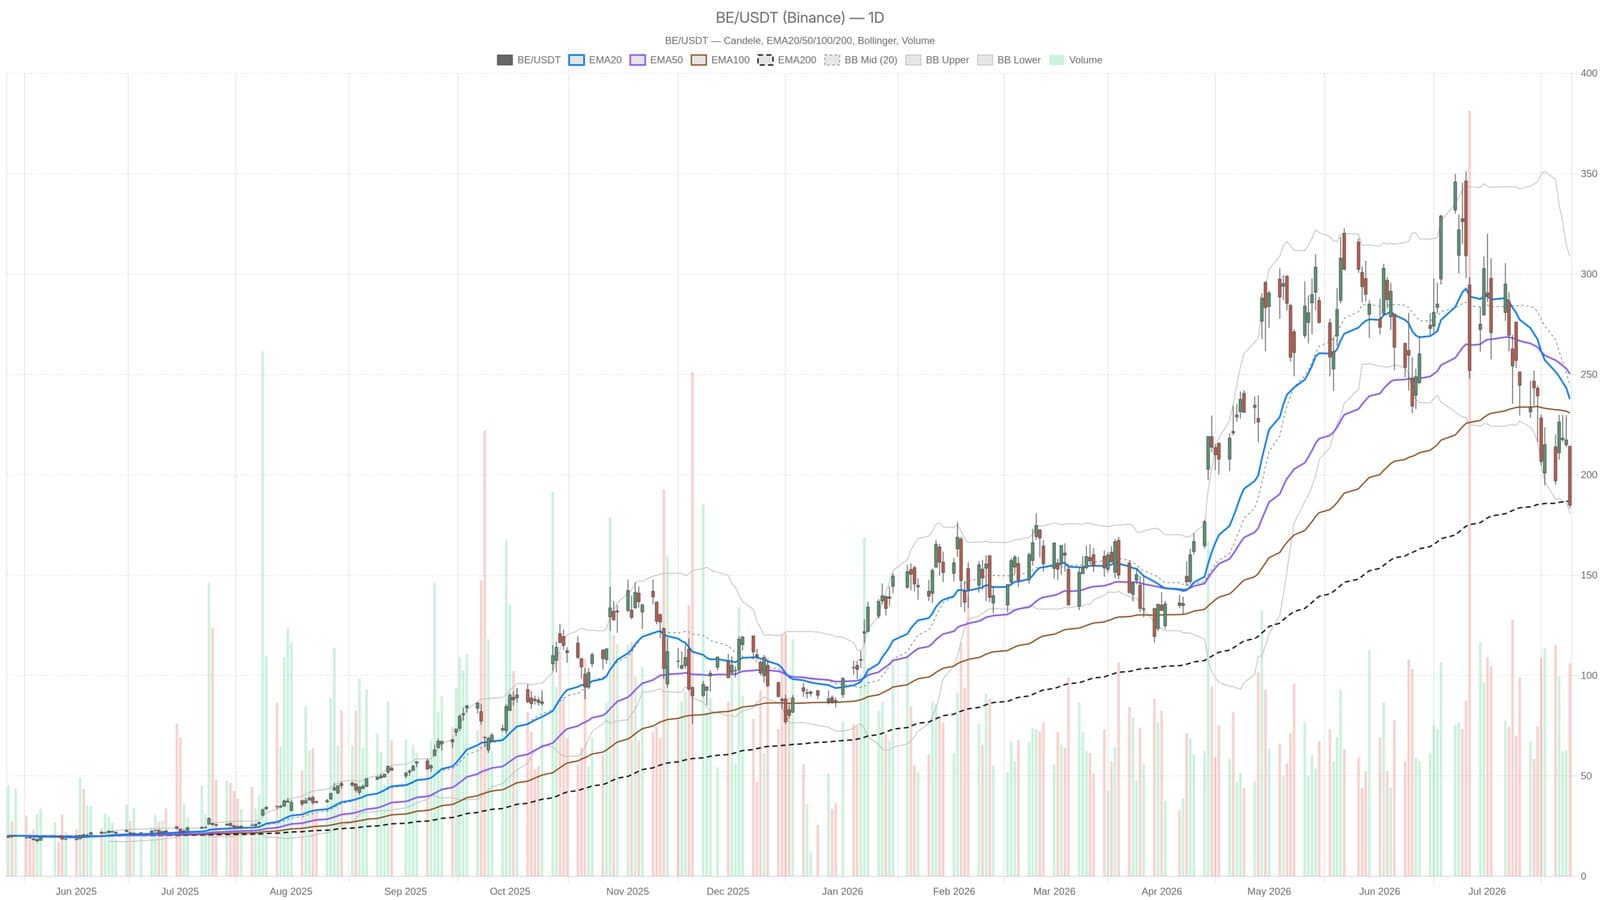
Bloom Energy’s shares plunged 43% in July, closing at $184.89 on July 24, confirming a sharp bearish trend that dominates all key timeframes. The company faces a critical moment as its second-quarter earnings report is set for release on July 28, with investors eyeing the results for signs of a turnaround.
The daily technical indicators paint a grim picture: the Relative Strength Index (RSI) at 36.11 signals persistent selling pressure, while the Moving Average Convergence Divergence (MACD) remains deeply negative with no signs of easing momentum. The price currently trades below key moving averages EMA20 at $237.78, EMA50 at $250.27, and EMA200 at $186.84 indicating a major breakdown in trend structure, not just a technical hiccup.
Struggling to Find Support amid Elevated Volatility
Volatility is notably high, with an Average True Range (ATR) of $26.32 reflecting wide price swings. The lower Bollinger Band around $180.51 marks a potential support zone, though the next important pivot lies at $174.01. If the stock falls below EMA200, it could trigger further declines. On the hourly chart, the bearish pattern is stark: shares trade below all key hourly EMAs (EMA20 at $207.69, EMA50 at $217.35, and EMA200 at $250.84), leaving no immediate upper-level support.
Yet, there’s a key factor that may affect this narrative. Bloom Energy holds a contracted backlog valued near $20 billion alongside a strategic deal with Oracle focused on fuel-cell technology. These elements provide tangible prospects for future growth and could weigh heavily on investor sentiment when the earnings report drops.
Still, market participants should brace for unpredictability due to heightened volatility. The wide range of daily price swings and prevailing downtrend make pre-earnings positioning particularly risky. Bloom Energy’s upcoming report on July 28 will be decisive in setting the next phase for the stock, either reinforcing the recent downtrend or sparking a recovery.