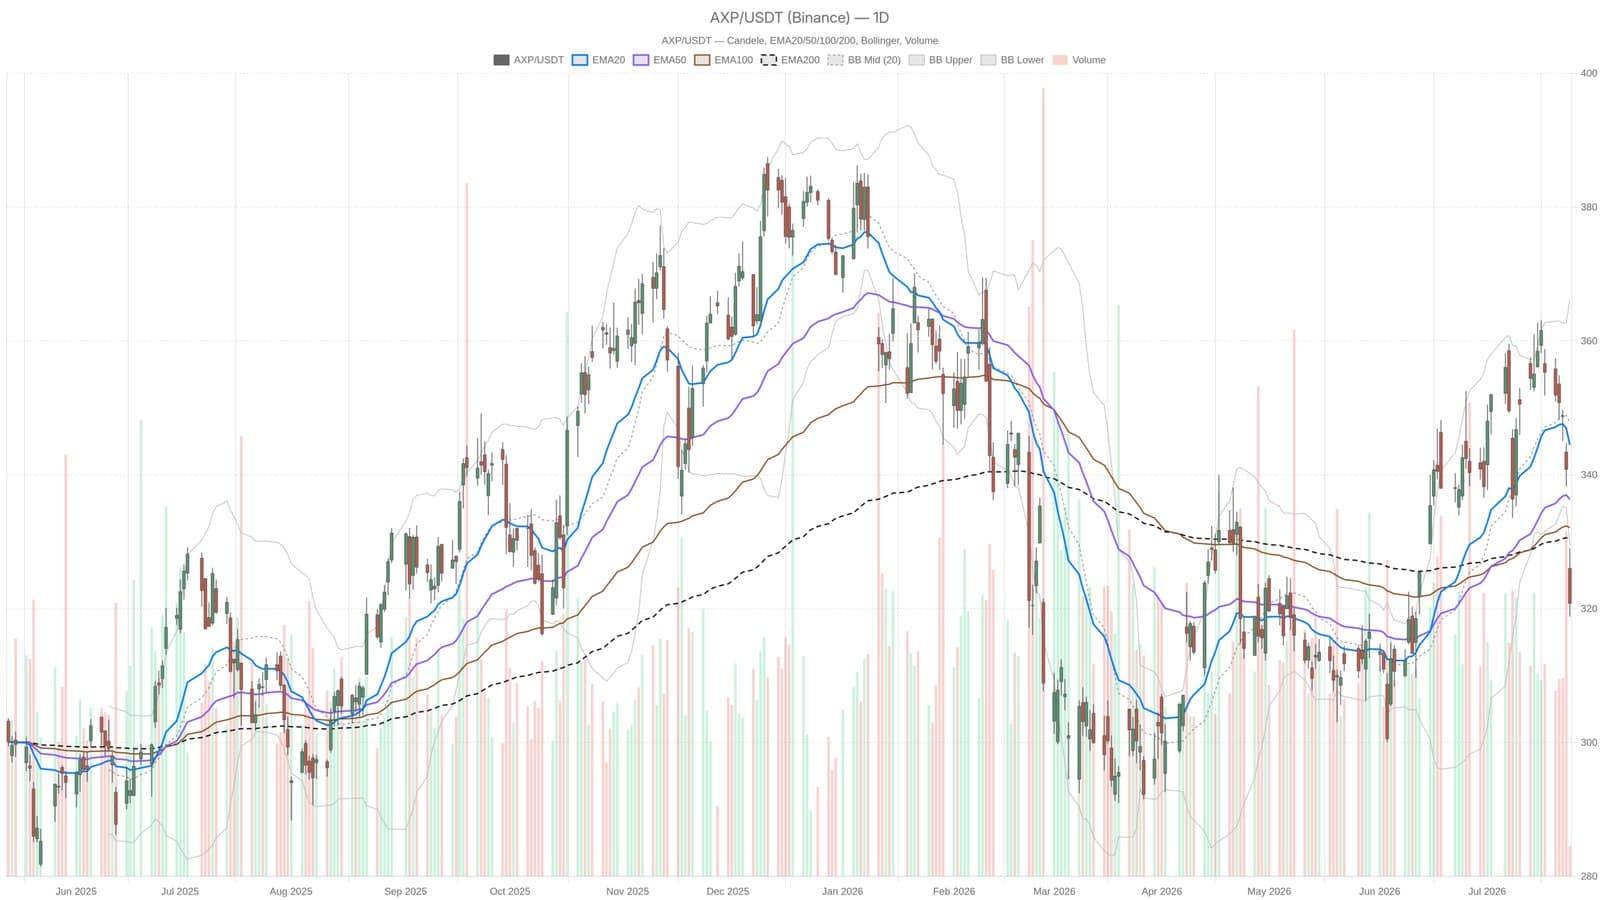
American Express shares took a hit on July 24, 2026, slipping after the company reported second-quarter results that beat profit forecasts but fell short on revenue. Despite an 8% increase in earnings per share, the market focused on the revenue miss, pushing the stock down more than 2% in premarket trading and settling near $320.80 by mid-morning.
The company posted Q2 earnings of $4.53 per share, outperforming analyst predictions, driven by higher cardholder spending, fewer delinquencies, and growing demand for premium cards like Gold and Platinum. However, the revenue figure failed to meet market expectations, prompting investors to react negatively.
Technical Indicators Signal Downtrend
The stock price closed below its key moving averages, including the EMA20 at $344.47, EMA50 at $336.34, and EMA200 at $330.49, indicating a deteriorating trend across all relevant time frames. This breakdown below the EMA200, which had been a key long-term support, heightens concerns about the stock’s near-term prospects.
The daily Bollinger Band lower limit is at $329.49, and American Express has already fallen beneath this threshold, suggesting elevated short-term selling pressure. Momentum metrics back this up: the daily RSI hovered near oversold levels at 34.56 without indicating a reversal, while the MACD histogram registered a negative reading, confirming downside momentum.
The stock is experiencing increased volatility, with an average true range (ATR) of nearly $9.71, meaning intraday price swings of about $10 have become typical. Key levels to watch include resistance at the daily pivot of $322.87 and support near $316.74.
Market sentiment appears to punish the revenue shortfall more harshly than it rewards the earnings beat, reflecting investor focus on top-line growth amid a complex economic backdrop. This trend resembles other recent market reactions seen in the fintech space, contrasting with upbeat moves in some sectors, as Booz Allen’s post-earnings rally illustrates.